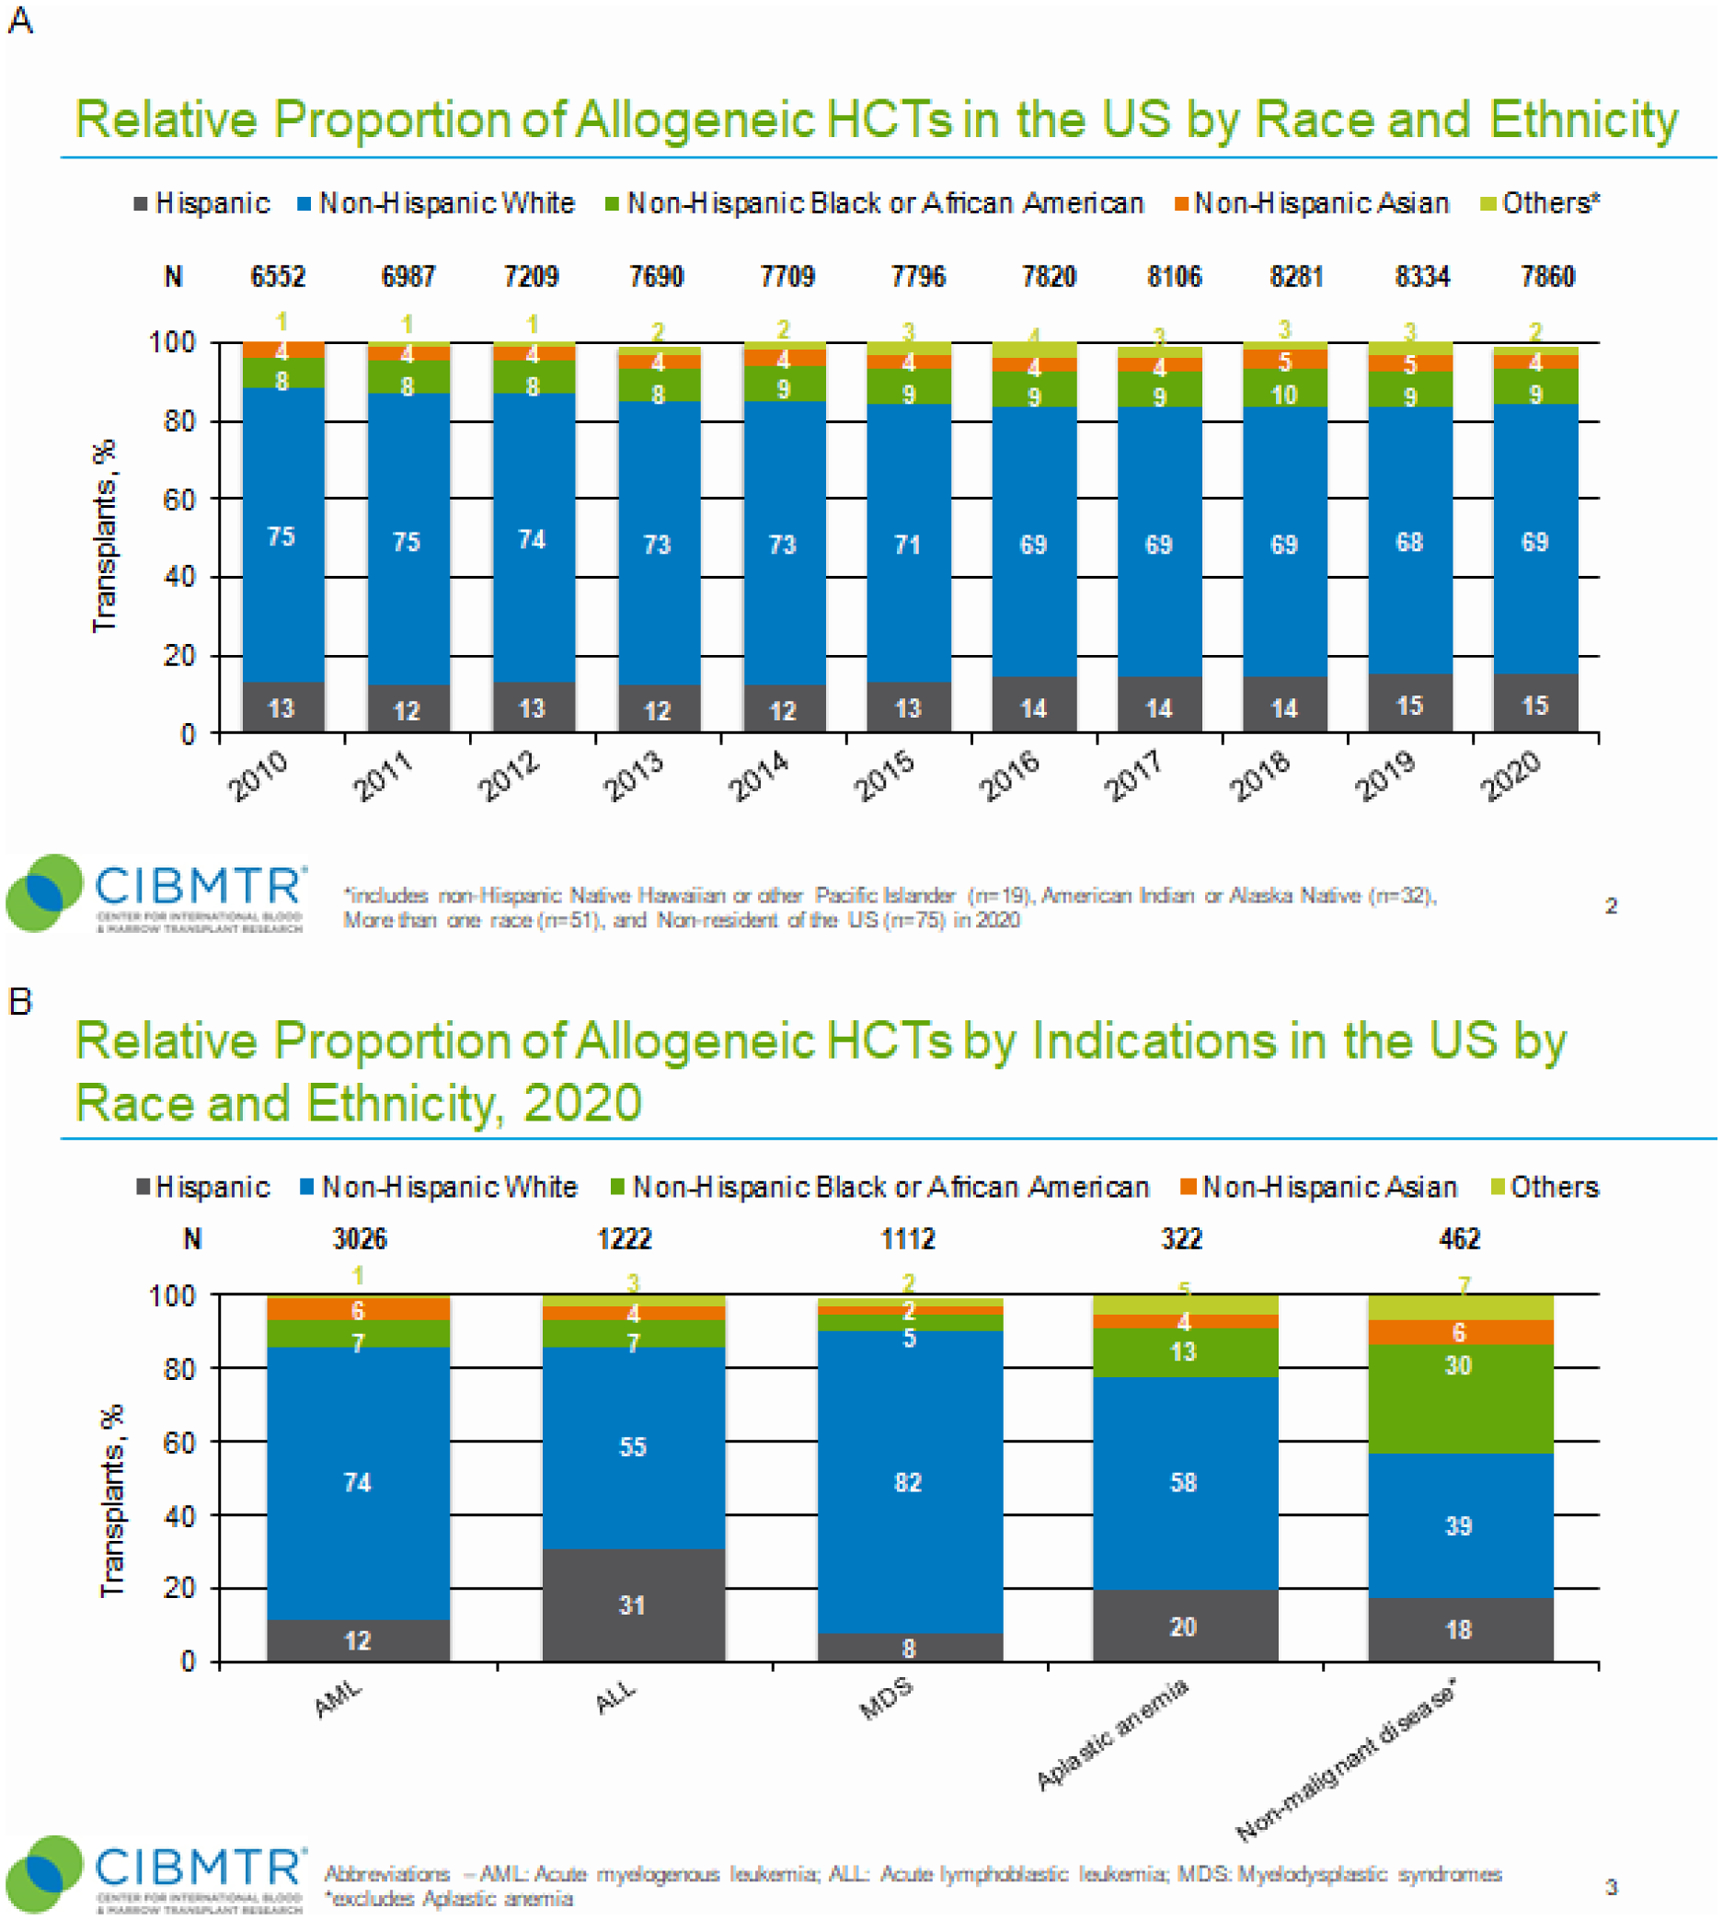
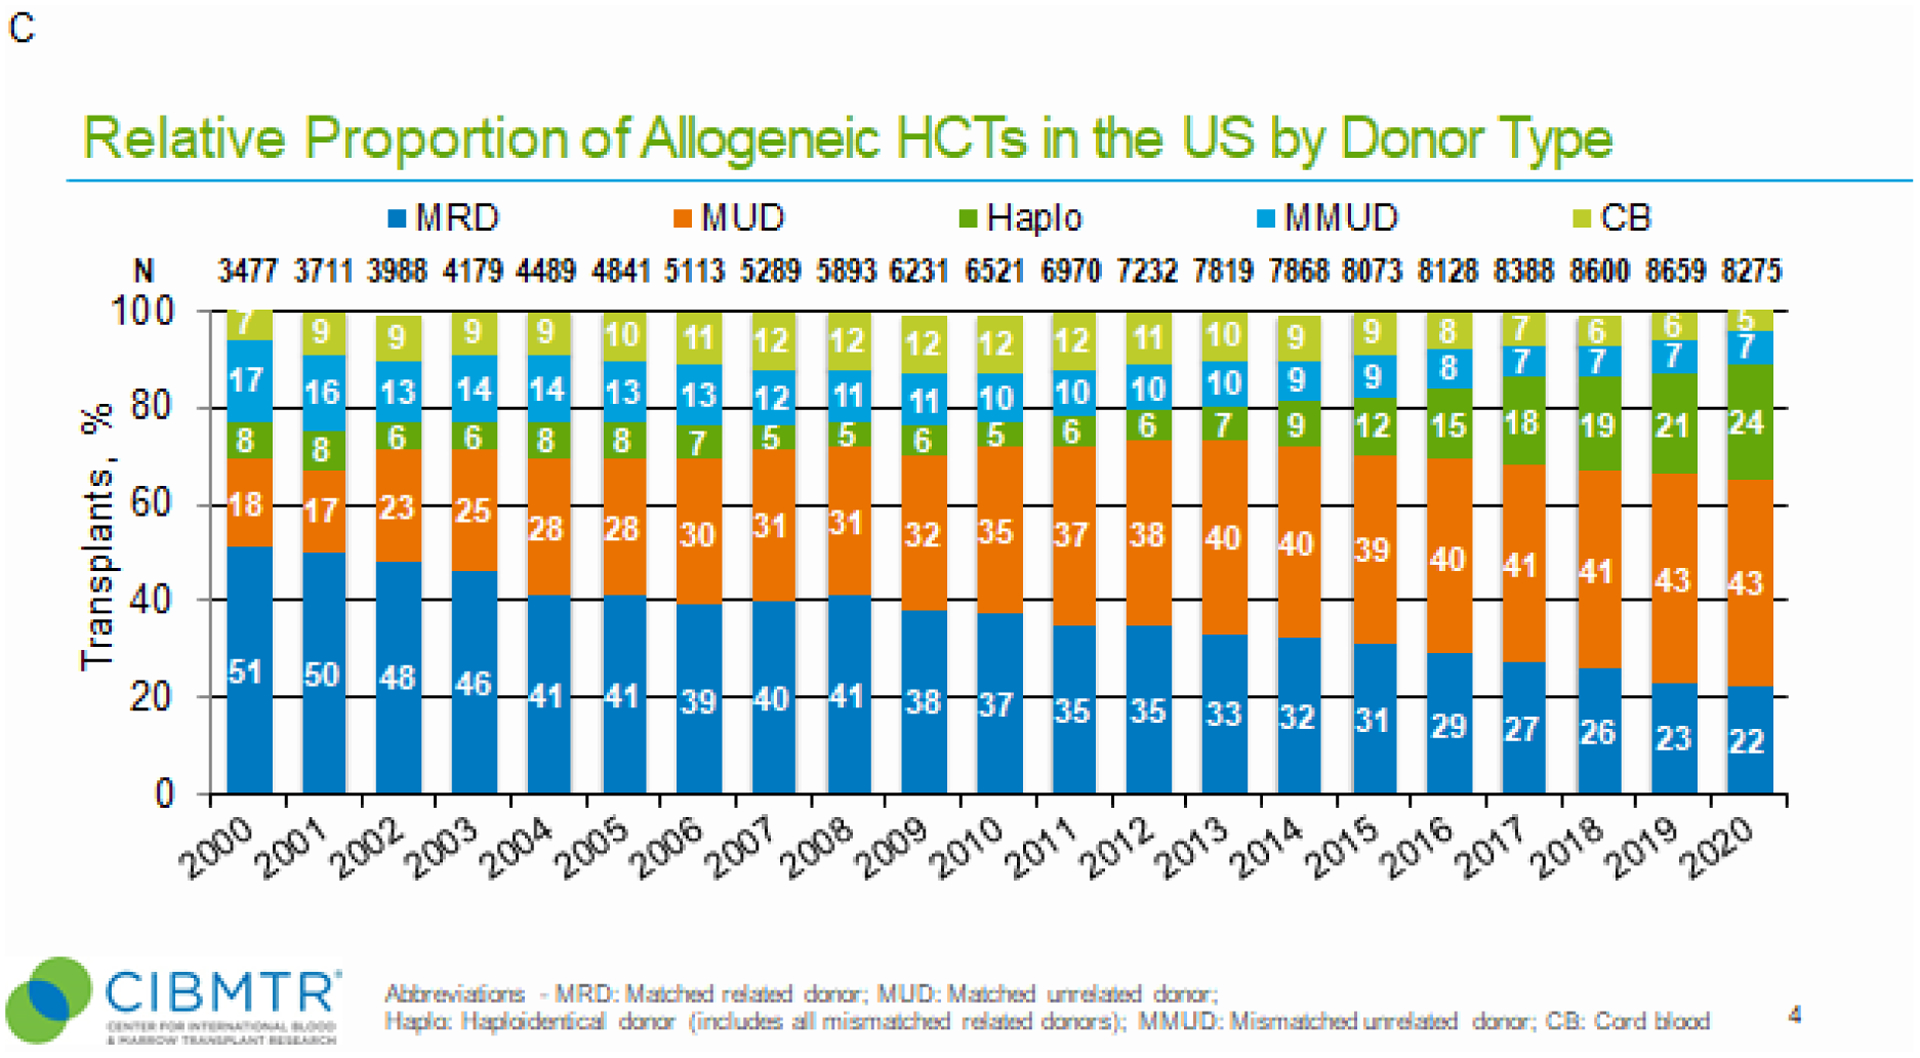
Figure 1. Relative proportion of allogeneic hematopoietic cell transplants (HCTs) in the United States by recipient race and ethnicity, disease indications, and donor types.


Panel A, Relative proportion of allogeneic HCTs in the U.S. by recipient race and ethnicity (2010–2020). For each year, proportions of transplants by indicated race and ethnicity group is shown as percentage of absolute number of transplants performed (N) for that year. “Other” race and ethnicity group includes non-Hispanic Native Hawaiian or other Pacific Islander, American Indian or Alaska Native, more than one race, and non-resident of the U.S. Panel B, Relative proportion of allogeneic HCTs by disease indications in the U.S. by race and ethnicity in 2020. For each year, proportions of transplants by indicated disease indication is shown as percentage of absolute number of transplants performed (N) for that year. Non-malignant diseases category excludes aplastic anemia. ALL, acute lymphoblastic leukemia; AML, acute myeloid leukemia; MDS, myelodysplastic syndromes. Panel C, Relative proportion of allogeneic HCT in the U.S. by donor type (2010–2020). For each year, proportions of transplants by indicated donor type is shown as percentage of absolute number of transplants performed (N) for that year. CB, cord blood; Haplo, haploidentical donor; MMUD, mismatched unrelated donor; MRD, matched related donor; MUD, matched unrelated donor.
