Figure 3.
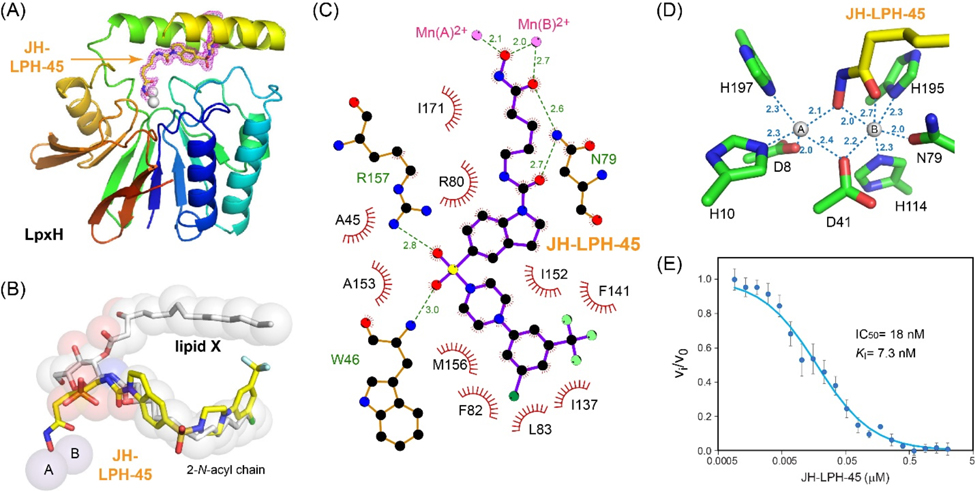
Inhibition of KpLpxH by 8 (JH-LPH-45). (A) Ribbon diagram of the KpLpxH/JH-LPH-45 complex. KpLpxH is colored in rainbow, with the N-terminus in blue and C-terminus in red. JH-LPH-45 and the di-manganese cluster are shown in the stick and sphere models, respectively. The purple mesh represents the 2mFo-DFc map of JH-LPH-45 at 1s. (B) An enlarged view of JH-LPH-45. Superimposition of the KpLpxH/JH-LPH-45 complex with the previously reported KpLpxH/lipid X complex (PDB: 6PH9) shows that the compound competes with the 2-N-acyl chain of lipid X, but with its acyl-hydroxamate group chelating the active site di-manganese cluster. (C) Interactions between JH-LPH-45 and LpxH residues. The interaction map was generated by LigPlot+.[24] (D) Metal chelation geometry. Distances between the atoms in the hydroxamate group and the di-manganese cluster are labeled with dashed lines. (E) The IC50 curve of the KpLpxH inhibition by JH-LPH-45. Error bars represent the standard error of measurement (SEM, n=3).

