
Figure 2.
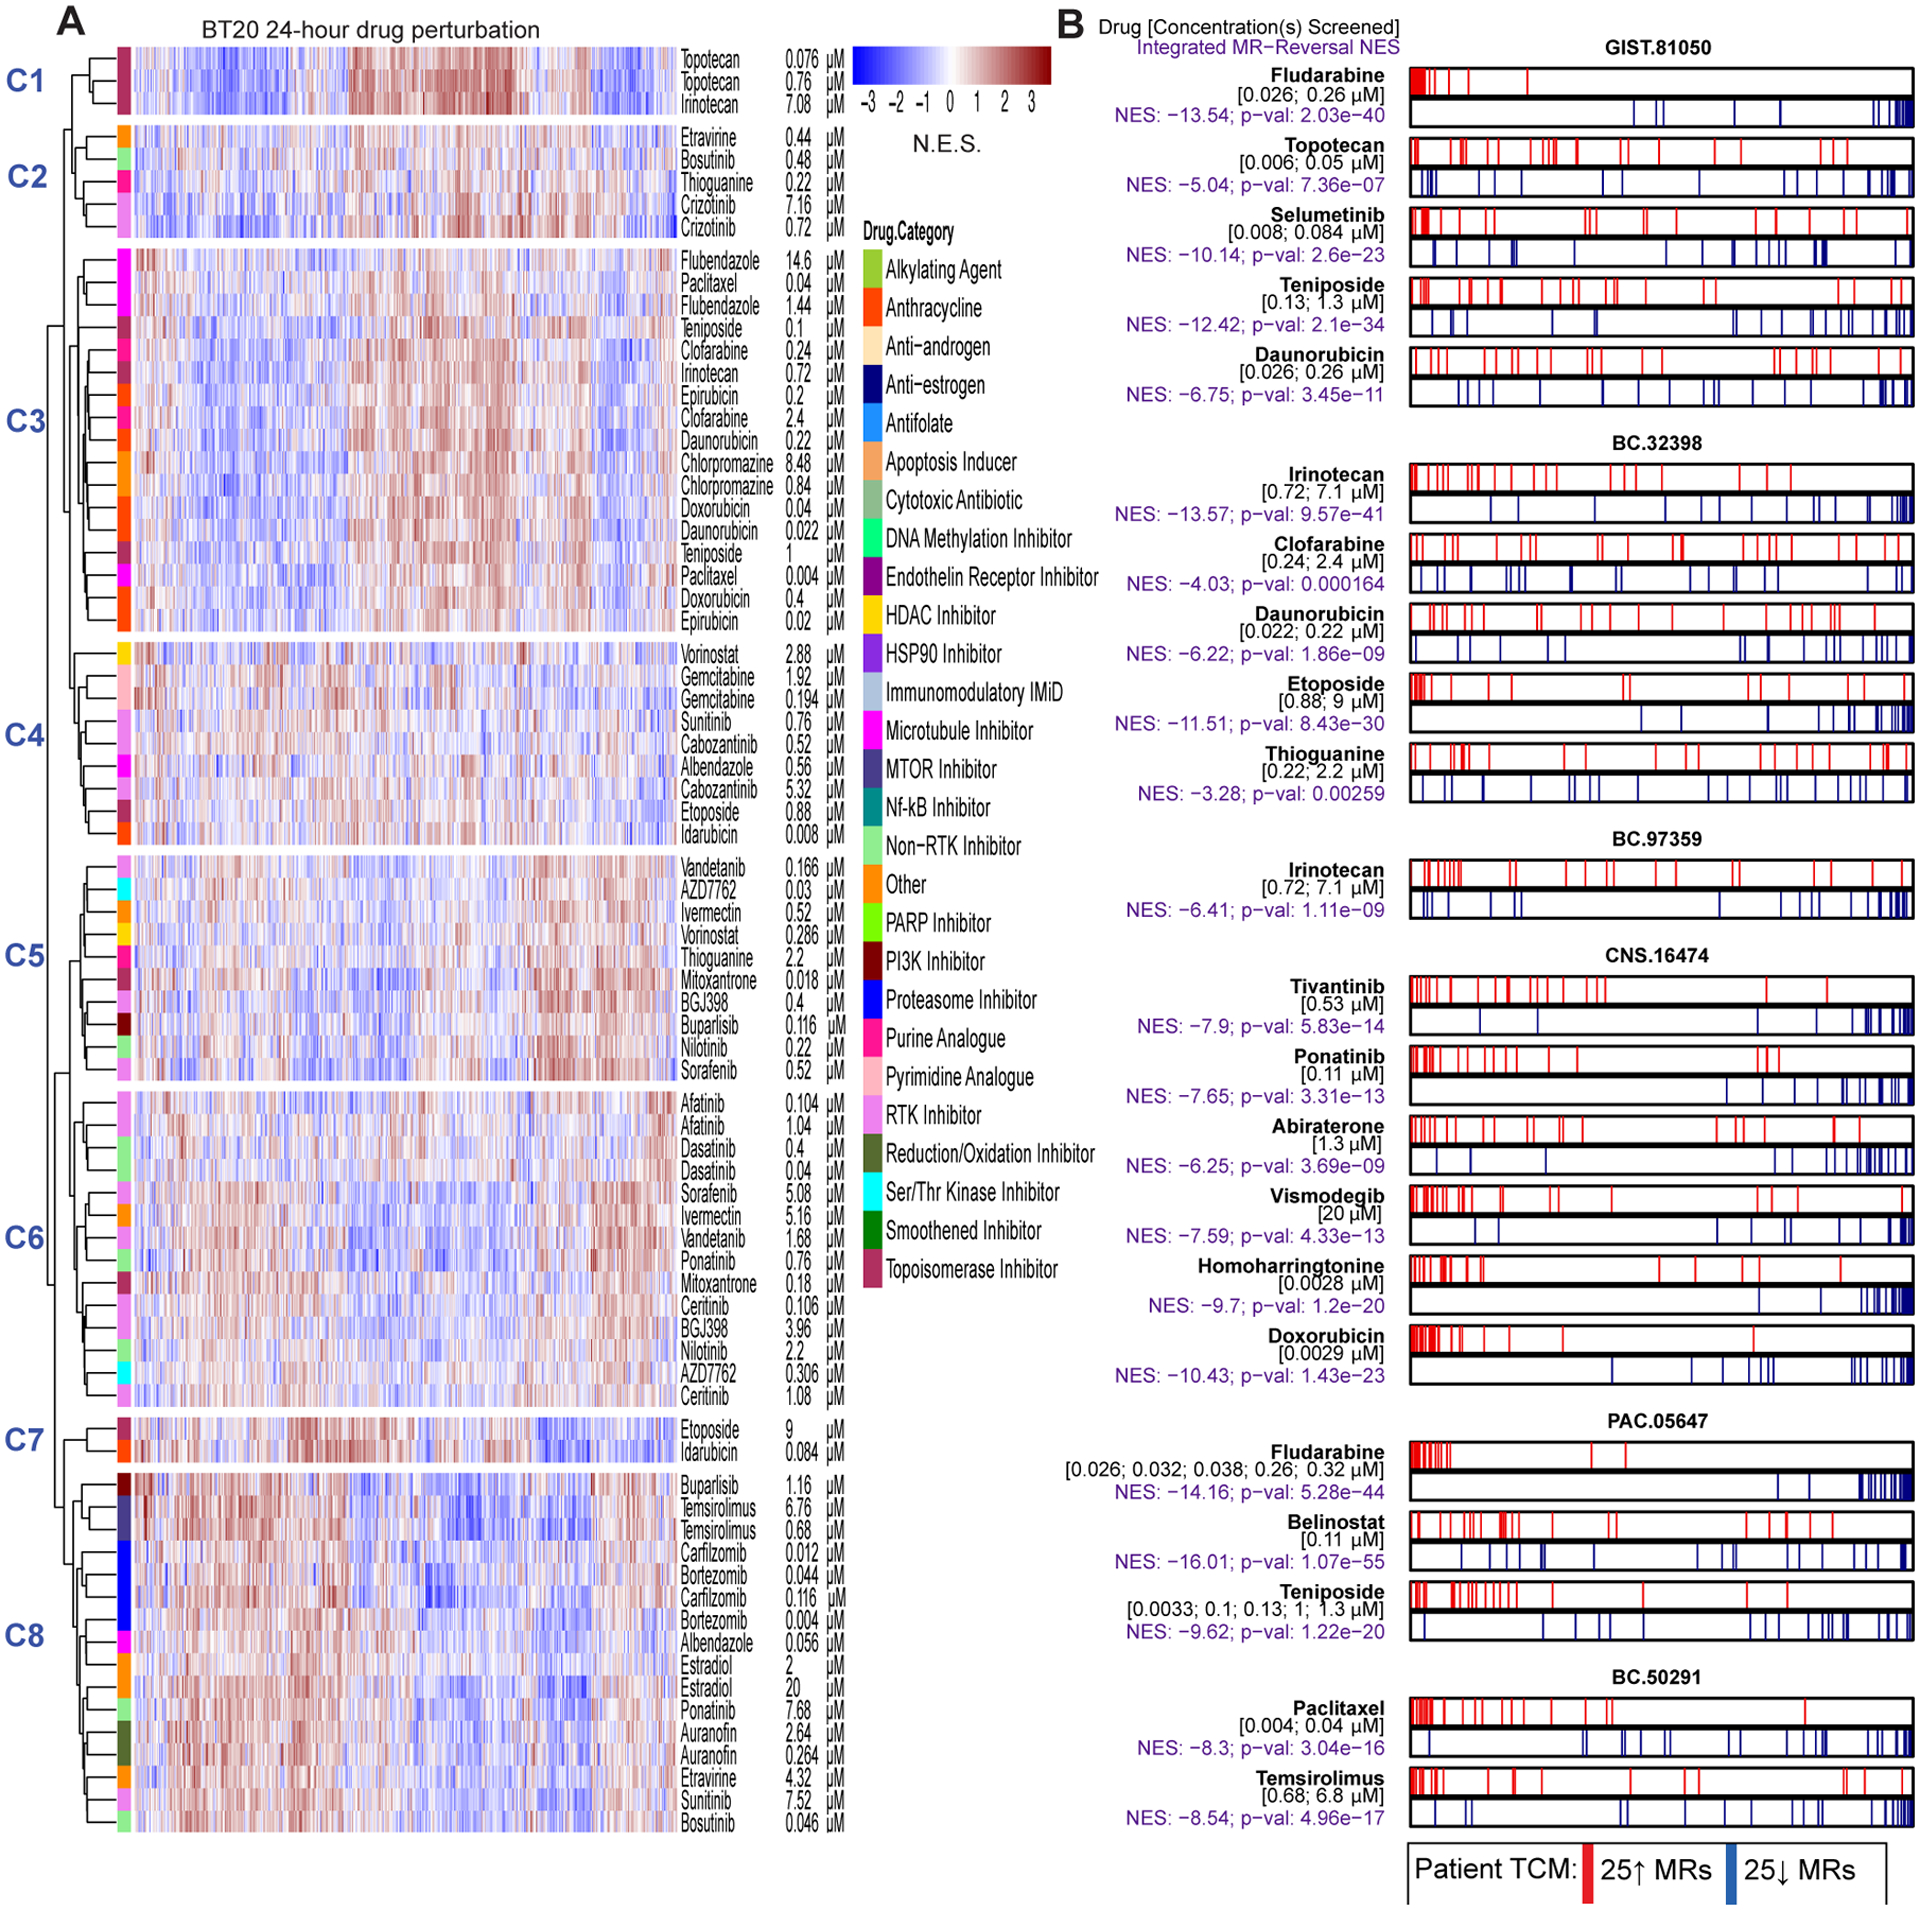
Drug context-specific mechanism and tumor checkpoint module (TCM)-inversion. (A) As an illustrative example, we show a heatmap for the 24-hour drug perturbation in the BT20 breast cancer cell line. The heatmap shows the differential protein activity profile of 38 drugs in BT20 cells compared to vehicle control, annotated by their canonical mechanism and the two sublethal concentrations (EC20 and one-tenth of EC20) screened. VIPER monitored proteins are shown in the columns and we use unsupervised hierarchical clustering to highlight drugs that induce similar transcriptional response, i.e. context-specific observed mechanism of action. (B) Perturbation screens in five relevant cell lines were used to generate the OncoTreat drug predictions we report on here. OncoTreat uses the context-matched de novo drug mechanism information to identify top TCM-inverter drugs. For each patient Id (e.g., GIST-81050) and predicted drug (e.g., fludarabine), we show the placement of the 25 most activated (red bars) and 25 most inactivated (blue bars) patient tumor master regulator (MR) proteins on the drug-induced signature in the cognate cell line(s)—proteins sorted left to right from the most differentially inactivated to the most activated in drug- vs. vehicle control-treated cells. For each model and drug, we report the concentrations whose effect was averaged to rank protein activity, the normalized enrichment score (NES) assessing TCM-inversion in the drug signature, as measured by the aREA algorithm, and the associated p-value. Negative NES indicates TCM-inversion. All but two predictions met the predefined significance threshold (Bonferroni p < 10−5), with clofarabine and thioguanine borderline predictions for BC-32398. For the pancreatic tumor (PAC-05647), drug perturbation profiles in the ASPC1 cell line were not available in time to predict drugs for in vivo testing. Thus, predictions were based on OncoTreat analysis using non-matched cell line models, BT20, GIST430, GISTT1, and IOMM, and integrated using Fisher’s method.