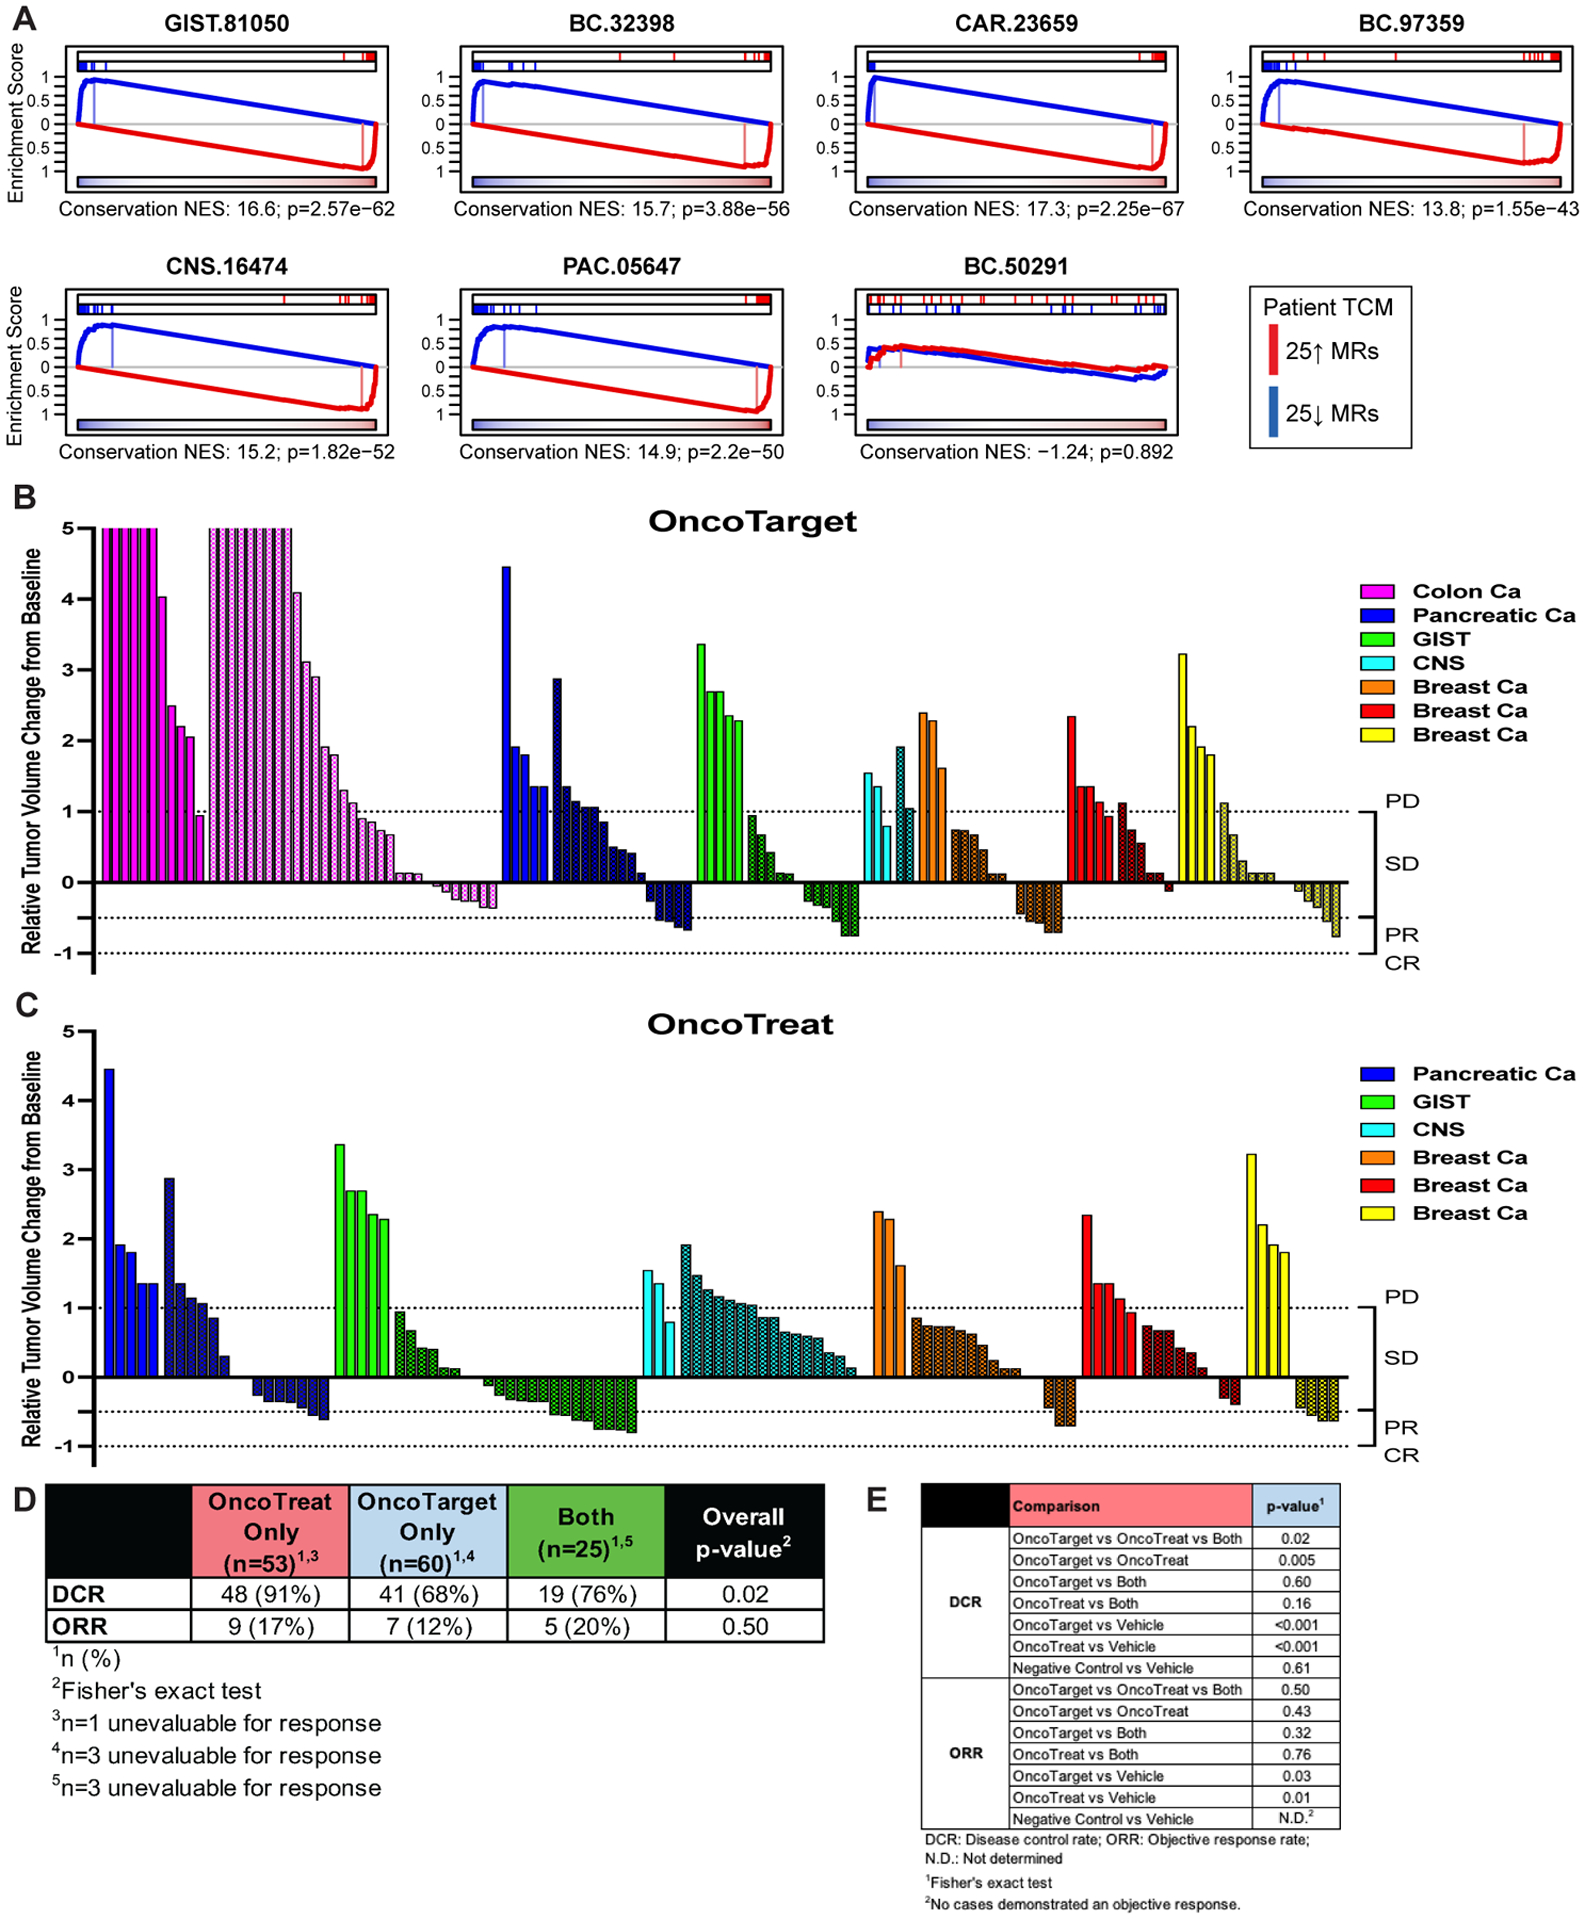
Figure 3.

Treatment response in patient-derived xenograft (PDX) models. (A) Fidelity assessment of the seven PDX models. Enrichment of patient tumor master regulators (TCM) in differentially active and inactive proteins in mature P0-passage PDX tumor samples, assessed by OncoMatch. TCM activity was highly conserved in six out of seven models, but not in the BC-50291 breast cancer model, indicating significant early passage drift. (B, C) Waterfall plots for end-of-study time point showing the relative tumor volume change for mice treated for a median of 29 days with OncoTarget-predicted drugs in seven PDX models (B), and OncoTreat-predicted drugs in six PDX models (C). Plots are grouped and color coded by model, with vehicle (solid bars) and drug-treated (textured bars) mice within each PDX presented side by side. OncoTreat predictions were not made for CAR-23659 due to lack of completion of a drug perturbation screen in a cognate colon cancer cell line. (D) Summary of response rates at the end-of-study for each drug prediction category (OncoTreat Only, OncoTarget Only) including a non-overlapping category for drugs predicted by both OncoTarget and OncoTreat (Both). A disease control rate (stable disease + partial response + complete response) of 68% (n = 41/60) and objective response rate (partial + complete response) of 12% (n = 7/60) were observed when treating with OncoTarget-predicted drugs. Responses from OncoTarget [or both]-predicted drugs were primarily stable disease (n = 48) and partial response (n = 12). A disease control rate of 91% (n = 48/53) and objective response rate of 17% (n = 9/53) were observed when treating with OncoTreat-predicted drugs. OncoTreat [or both]-predicted drugs demonstrated stable disease (n = 55) and partial response (n = 14). Overall p-value (Fisher’s exact) is reported for DCR and ORR, assessing for a between groups difference in response rates across all drug prediction groups. (E) Summary statistics of overall and pairwise comparisons of drug prediction groups. Both OncoTarget and OncoTreat were highly accurate in predicting disease control (p < 10−3, 2-tailed U-test) and objective response (OncoTarget p = 0.03; OncoTreat p = 0.01) versus Vehicle control. Note, valid direct comparisons of OncoTarget and OncoTreat are limited by imbalances in number of predictions tested in different models.
