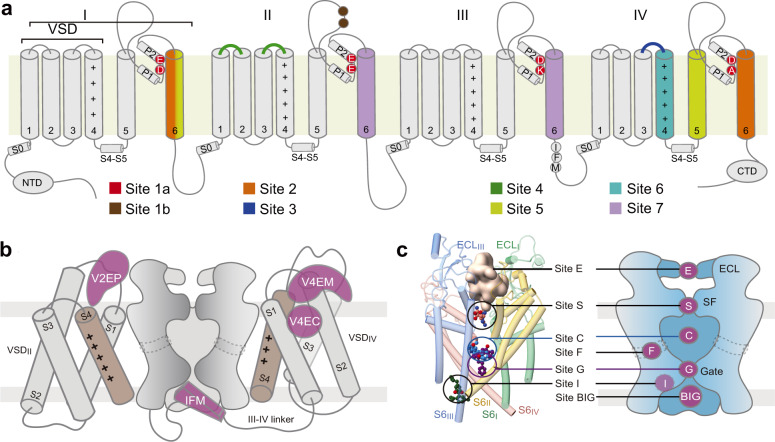
Fig. 5. Structural mapping of binding sites for Nav antagonists.
a Conventional mapping of drug and toxin-binding sites on the primary sequence of Nav channels. b Structural mapping of VSD sites for accommodating peptidic and small molecule ligands. Based on the new nomenclature system, these sites are named as VnEC/M/P. V: VSD; n: the repeat number; E: extracellular; C: cavity. M: membrane; P: pore domain. c The PD hosts multiple drug-binding sites. Left: Representative Nav inhibitors are mapped to the structural model of the PD. The peptide toxin μ-conotoxin KIIIA is shown as a pale pink surface that is encaged by the extracellular loops (Site E). TTX is shown as orange spheres at the entrance to the SF (Site S). Quinidine, propafenone and cannabidiol are shown as blue, purple and green spheres that bind to the cavity (Site C), the intracellular gate (Site G) and the inactivation site (Site I)65, respectively. A diagram of the druggable sites on the PD are shown on the right. Site F refers to the fenestration sites.

