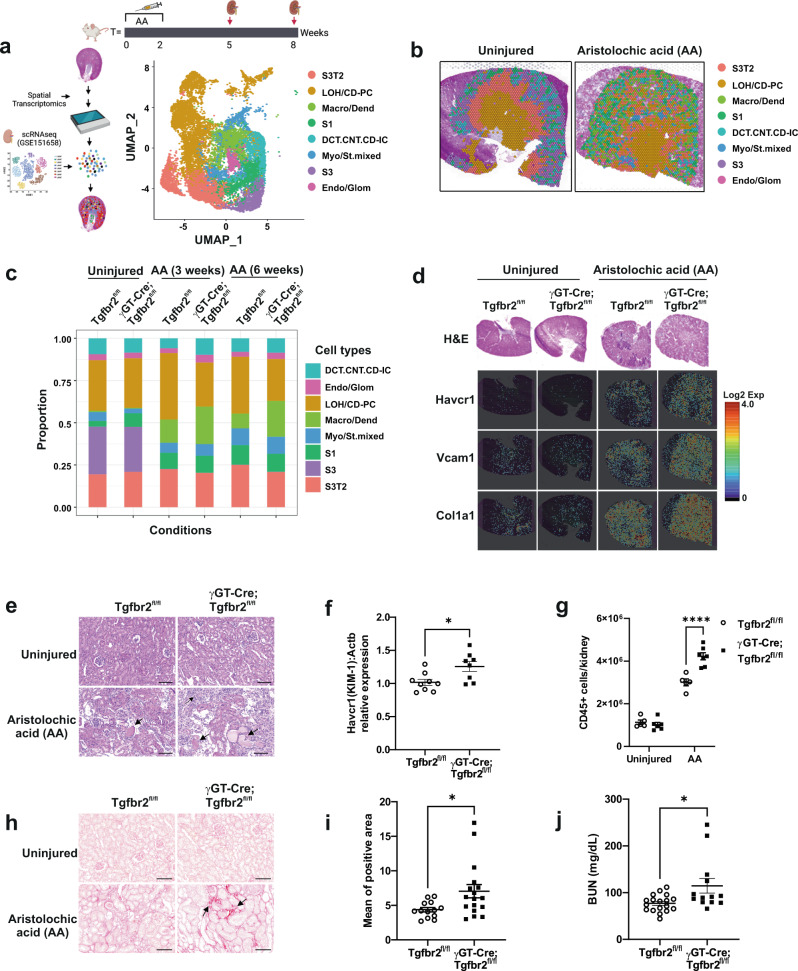
Fig. 1. Tubulo-interstitial remodeling and increased cortical injury and fibrosis in γGT-Cre;Tgfbr2fl/fl mice after AA injury.
a Schemes illustrating AA injury design, integrated data annotation strategy and renal cell types after dataset integration (UMAP plot). S3 type 2 PT cells (S3T2); Loop of Henle and principal cells (LOH/CD-PC); macrophages and dendritic cells (Macro/Dend.); S1 PT cells (S1); distal convoluted tubular, connecting and intercalated cells (DCT.CNT.CD-IC); myofibroblasts and stromal cells (Myo/St. mixed); S3 PT cells (S3); endothelial and glomerular cells (Endo/Glom). b Representative spatial plots of integrated clusters resolved on uninjured and injured kidney slices showing impaired cortico-medullary organization following injury. c Cell type proportions per conditions in the integrated data. d Representative H&E staining and spatial transcriptomics Cloupe browser kidney images with resolution of proximal tubule injury and fibrotic markers at baseline and 3 weeks after AA injury (one uninjured Tgfbr2fl/fl kidney, one uninjured γGT-Cre;Tgfbr2fl/fl kidney, one injured Tgfbr2fl/fl kidney and one injured γGT-Cre;Tgfbr2fl/fl kidney). Scale bars in source data. e Representative H&E images of kidneys from uninjured and 6 weeks AA injured mice. Arrows indicate injured tubules and interstitial cell infiltrate. f Relative Kim-1 mRNA levels in renal cortices 6 weeks after AA injury measured by RT-qPCR using Actb mRNA levels for normalization; n = 9 (Tgfbr2fl/fl) and 8 (γGT-Cre;Tgfbr2fl/fl) mice, p = 0.014. g Quantification of CD45+ cells from uninjured and injured renal leukocytes analyzed by FACS; n = 6 per genotypes of uninjured mice; n = 5 (Tgfbr2fl/fl) and 7 (γGT-Cre;Tgfbr2fl/fl) for injured mice, p < 0.0001. h Sirius red staining of kidneys from uninjured and AA injured mice showing collagen accumulation in red. Arrows indicate fibrotic areas. i Quantification of Sirius red positive area; n = 13 (Tgfbr2fl/fl) and 17 (γGT-Cre;Tgfbr2fl/fl) mice, p = 0.0174 (two-tailed Mann–Whitney test). j Plasma BUN levels measured 6 weeks after AA injury; n = 18 (Tgfbr2fl/fl) and 13 (γGT-Cre;Tgfbr2fl/fl) mice, p = 0.0175 (two-tailed Mann–Whitney test). All scale bars (e and h) represent 100 μm; dots represent the number of animals per group (f, g, i and j). Data are presented as mean values ± SEM. Statistical significance was determined by unpaired Student’s t test (two groups) or two-way ANOVA followed by Sidak’s multiple comparisons test with p < 0.05 considered statistically significant unless otherwise stated. *p < 0.05; ****p < 0.0001. Source data are provided as a Source data file.

