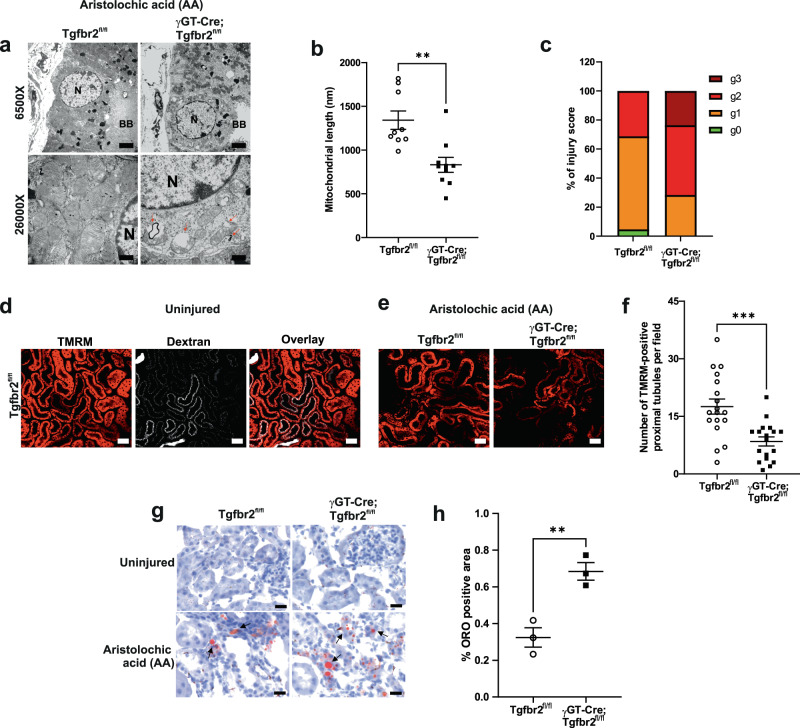
Fig. 2. Increased mitochondrial injury and dysfunction in γGT-Cre;Tgfbr2fl/fl mice 3 weeks after AA injury.
a Representative transmission electron microscopy images showing increased mitochondrial injury (decreased cristae number, increased vacuolization, and myelin figures) in the PT from γGT-Cre;Tgfbr2fl/fl kidneys. Scale bars represent 500 nm; N = nucleus; BB = brush border; arrows highlight vacuolated mitochondria and presence of myelin figures. b, c Quantification of mitochondrial length (n = 9 different areas from 2 different animals per group, p = 0.0014) and injury score (g0: no injury, g1: slight decrease of cristae number or small vacuoles; g2: severe decrease of cristae or big vacuoles formation; g3: severe decrease of cristae, big vacuoles formation and myelin figures) in proximal tubules. The dots represent the mean of PT mitochondria length in the representative cortical area per group. d Representative multiphoton live microscopy images illustrating PT dextran uptake and TMRM incorporation in mitochondria from uninjured kidneys to respectively assess PT absorptive function and mitochondrial membrane potential. Scale bars represent 50 μm. Two groups (4 animals/8 kidneys) were analyzed in two independent experiments. e Representative TMRM images showing decreased mitochondrial membrane potential in the PTs from injured γGT-Cre;Tgfbr2fl/fl. Scale bars represent 50 µm. f Quantification of TMRM in injured PTs. Every dot represents the number of TMRM positive tubules in the field of 900 μm2 (in one capture); n = 2 (Tgfbr2fl/fl) and 2 (γGT-Cre;Tgfbr2fl/fl) mice, p = 0.0004. g Representative image of oil red O staining showing increased lipids deposition (red) in the renal cortex of γGT-Cre;Tgfbr2fl/fl mice. Scale bars represent 50 μm. h Quantification of oil red O positive area in the renal cortex of injured mice; n = 3 (Tgfbr2fl/fl) and 3 (γGT-Cre;Tgfbr2fl/fl) mice, p = 0.0073. The dots represent the number of animals per group in oil red O staining. Data are presented as mean values ± SEM. Statistical significance was determined by unpaired Student’s t test (two groups) with p < 0.05 considered statistically significant. **p < 0.01; ***p < 0.001. Source data are provided as a Source data file.

