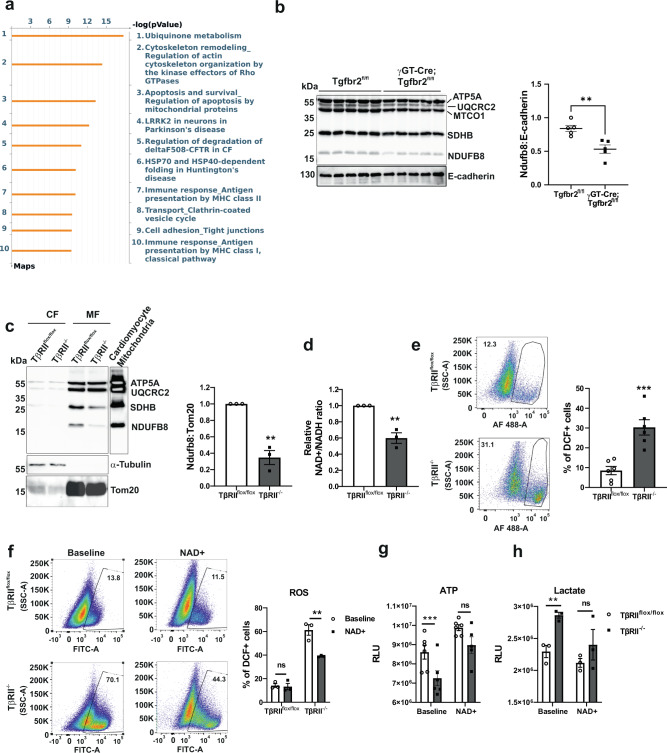
Fig. 3. Proximal tubule TβRII deletion disrupts mitochondrial complex I leading to oxidative stress and a metabolic rewiring.
a Metacore pathway analysis of differentially expressed genes in uninjured PT clusters showing the top 10 significantly affected pathways in γGT-Cre;Tgfbr2fl/fl compared to Tgfbr2fl/fl. b Immunoblotting of OXPHOS proteins showing a significant decrease of complex I (NDUFB8) expression in uninjured renal cortices of γGT-Cre;Tgfbr2fl/fl mice compared to their Tgfbr2fl/fl littermates; n = 5 (Tgfbr2fl/fl) and 5 (γGT-Cre;Tgfbr2fl/fl) mice, p = 0.0041. E-cadherin is used as marker of renal parenchyma and loading control. The dots represent the number of animals per group. c Cell fractionation followed by immunoblotting and quantification of OXPHOS proteins showing a significant decrease of complex I (NDUFB8) basal expression in mitochondria of TβRII−/− PT cells (n = 3 independent experiments, p = 0.0015). d Bioluminescence measurement of NAD + /NADH ratios showing a decreased relative ratio in TβRII−/− PT cells (n = 3 independent biological replicates, p = 0.0036). e FACS analysis of DCF-positive cells showing increased basal ROS production in TβRII−/− PT cells (n = 6 independent experiments, p = 0.0006). f NAD+ treatment significantly decreased ROS in TβRII−/− PT cells, assessed with DCF and measured by FACS (n = 3 independent biological replicates, p = 0.0027). g NAD+ treatment increased ATP production in TβRII−/− PT cells to the same level as in TβRIIflox/flox PT cells, measured by a bioluminescence assay (n = 6 independent biological replicates, baseline p = 0.0001 and NAD+ treatment p = 0.4025). h NAD+ treatment decreased lactate production in TβRII−/− PT cells to the level of TβRIIflox/flox PT cells, measured by a bioluminescence assay (n = 3 independent biological replicates, baseline p = 0.0057 and NAD+ treatment p = 0.3175). Data are presented as mean values ± SEM. Statistical significance was determined by unpaired Student’s t test (two groups) or two-way ANOVA followed by Sidak’s multiple comparisons test with p < 0.05 considered statistically significant. *p < 0.05; **p < 0.01; ****p < 0.0001. Source data are provided as a Source data file.

