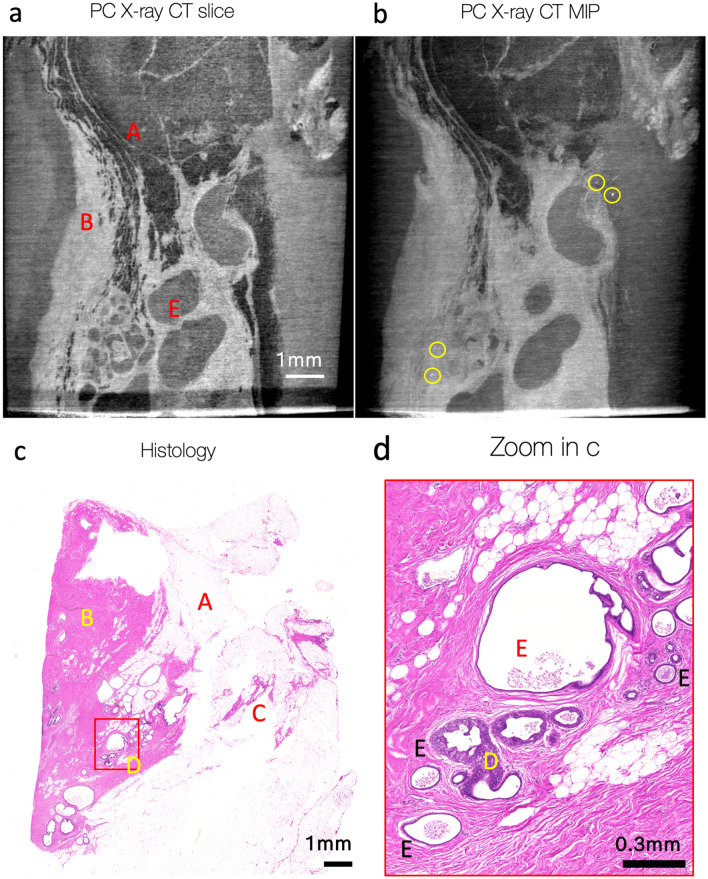
Figure 3.
Lower part of sample 2 (with respect to the Fig. 2, b), examined with histology and GI phase-contrast X-ray CT (MAAST setup). X-ray CT (a–b) and histological (c–d) slices are not fully mutually aligned. (a)— one slice in the tomographic reconstruction of the data acquired with MAAST X-ray setup. It reveals some features, that can be also identified at the histological cross-section (c): fat (A), connecting tissue (B), vessels (C), benign apocrine cysts (E). (b)—Maximum Intensity Projection over 50 slices of the tomogram in (a) helps to notice bright white spots with different intensities that are likely calcifications. (d)—zoomed-in area at the histological slide (red square, c) highlights benign secretory calcifications inside cysts (E), as well as several duct cross-sections with low-grade DCIS.

