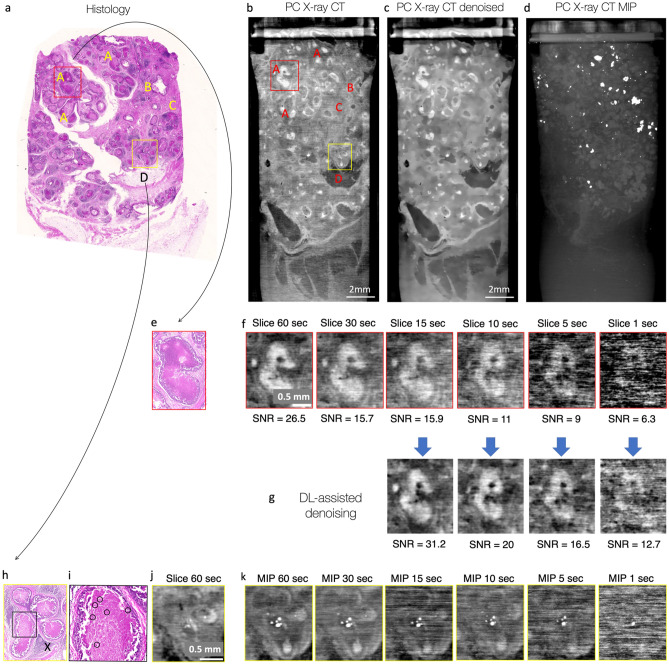
Figure 4.
Sample 3 with high-grade DCIS was examined with histology and GI phase-contrast X-ray CT (MAAST setup). (a)—Histological examination reveals numerous malignant cells inside milk ducts (A). Less affected ducts (B), fat (D) and fibrosis (pink area in the connecting tissue; for example, C) are also visible. (b)—One tomographic slice of the data acquired with MAAST X-ray setup reveals most of the features, identified at the histological cross-section. Absorbing areas inside the necrotic ducts (A) are clearly distinguishable. (c)—denoised version of the image b allows to better see the shapes of individual ducts. A non-local Means 2D filter was applied with smoothing factor 2 and auto-estimated sigma. (d)—Maximum Intensity Projection over 1000 slices of the tomogram at (b). The image reveals numerous calcification clusters, that are an indication of the severe necrosis inside milk ducts. (e)—zoomed-in yellow square from the histological slice (a) highlights necroses inside the milk duct associated to DCIS. (f)—while necrotic formations inside the duct are also nicely visible with X-ray CT, the contrast is highly dependent on the exposure time per image in a given CT scan. (g) Deep-learning Noise2Noise-based denoising allows to clearly visualize inhomogeneities inside the milk duct with three times decreased acquisition time: the image quality of denoised 10-s image is comparable with, and even superior to the quality of the original 30-s one (SNR of 20.4 vs 15.7). (h) zoomed-in red square from the histological slice (a) highlights three milk ducts with severe necrosis. Milk ducts are surrounded by areas with inflammation (X). (i)—zoomed-in area from (h) reveals small calcifications that grow on the necrotic formations (yellow circles), they are also visible as white saturated dots at the X-ray CT slice (j). (k) Maximum Intensity Projections over 20 slices help to highlight calcifications inside ducts more prominently—calcifications remain visible even when the contrast degrades while decreasing the exposure time per image in the CT scan.

