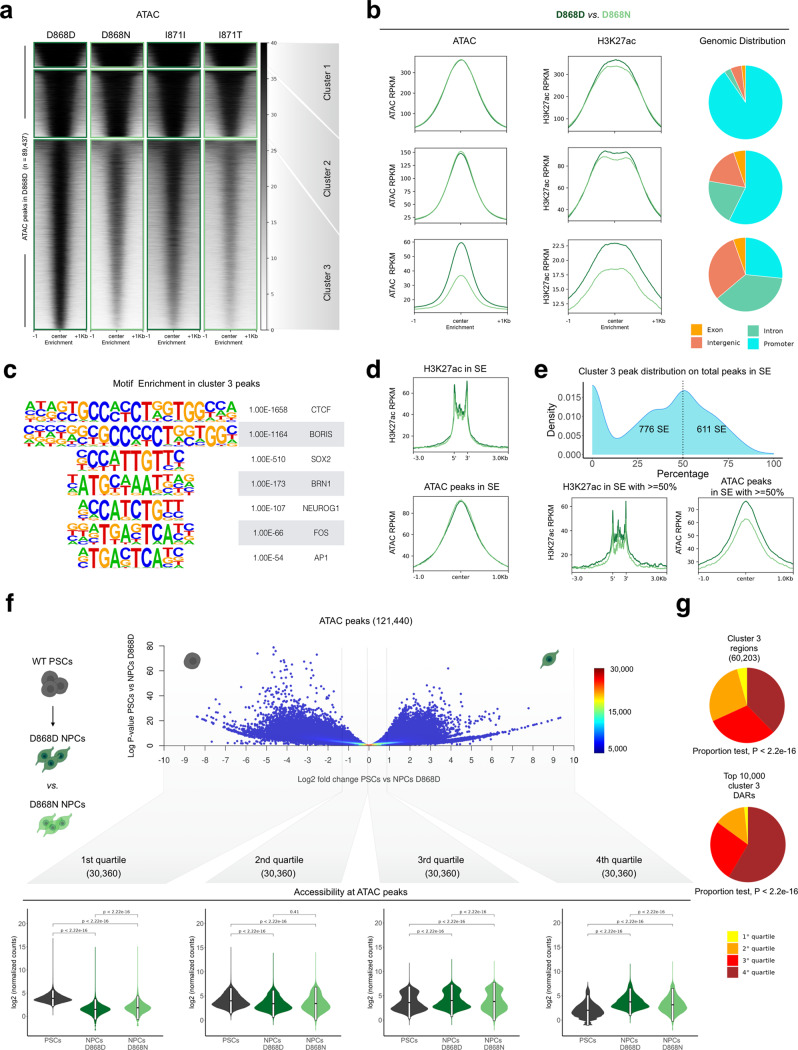
Fig. 2. SET accumulation impairs chromatin accessibility at distal regulatory region.
a Heatmap of ATAC normalized signal in control (D868D) NPC peaks, n = 89,437. Regions are clustered using k-means (n = 3), cluster1 = 8,033, cluster2 = 21,201, cluster3 = 60,203. b Density plot of normalized ATAC-seq and H3K27ac ChIP-seq signal in regions inside clusters of a, the median value of each sample inside all regions analyzed was plotted. Pie charts represent the genomic distribution of regions inside clusters of (a). c Homer motifs enrichment in cluster3 result summary. d Density plot of normalized ATAC-seq and H3K27ac ChIP-seq signal in super-enhancers (SEs), n = 1387. The median value of each sample inside all regions analyzed was plotted. e Top, density plot of SE based on the percentage of cluster 3 ATAC peaks present inside each SE. Bottom, density plots showing H3K27ac ChIP-seq (left) and ATAC-seq (right) normalized signal inside SEs with more than 50% of associated ATAC peaks belonging to cluster 3 of (a), n = 611. f Summary results of open chromatin dynamic analysis from PSCs to NPCs. Top, adapted volcano plot shows how open chromatin regions (n = 121,440) are ordered based on log2 fold change between PSCs and NPCs and the cutoff value of the four quartiles (1st: −10 to −1.35; 2nd: −1.34 to −0.027; 3rd: −0.026 to 0.9; 4th: 0.9 to 10). Color legend represent the number of regions summarize by each data point. Bottom, violin plots of ATAC-seq normalized counts are plotted for the associated regions each quartile (n = 30,360, statistic two-sided Wilcoxon-test. Boxplot with 25–75th percentiles, mean, and whiskers of minima to maxima). Drawings created with BioRender.com. g Pie charts showing the proportion of all (top) and the top 10,000 differential (bottom) ATAC peaks contained in cluster 3 in (a) found in each of the four quartiles.

