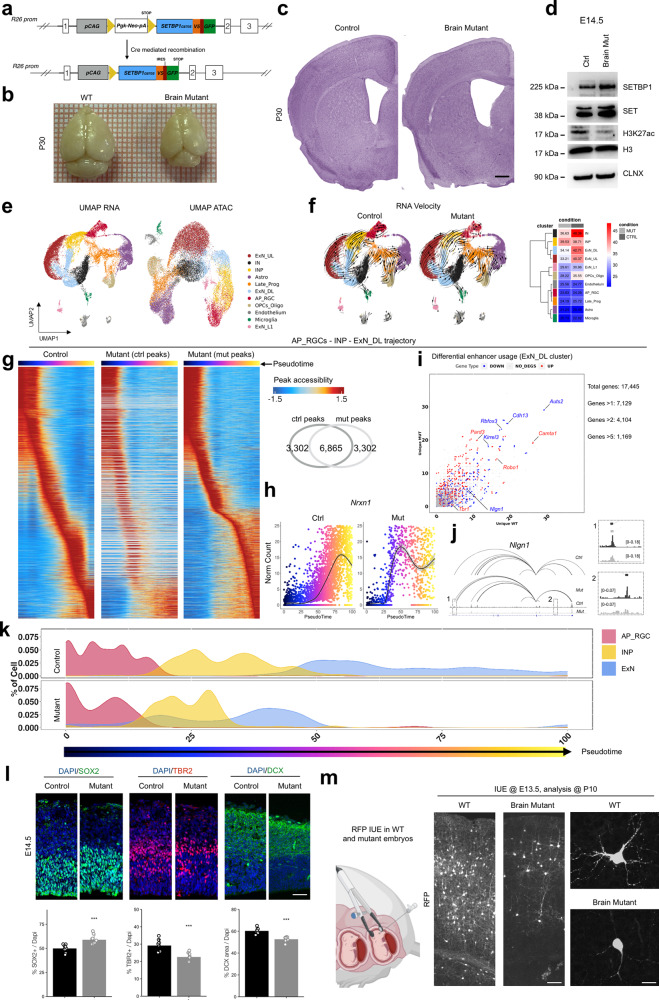
Fig. 6. SETBP1 overexpression induce brain developmental alterations in mouse model.
a Scheme of the modified Rosa26 with mutant SETBP1 (G870S) cDNA, before and after CRE recombination. b Brains of control (Cre-) and mutant (Cre+) P30 mice. Square side = 1 mm. c Nissl staining of P30 brains. Scale bar = 500 μm. d Western blot for SETBP1, SET, and H3K27ac levels: H3 and Calnexin (CLNX) are used as loading controls. e UMAP plots of scMultiome clusters. RNA (left) and ATAC (right) dataset. f UMAP of RNA velocity, each arrow shows the direction and speed of the velocity flow in both experimental conditions. Heatmaps on the left contains average velocity value for each cluster. g Heatmaps showing accessibility Z-score during AP_RGCs to ExN_DL trajectory. The left heatmap shows Z-score calculated in control condition, the middle heatmap shows Z-score calculated in control peaks using only mutant cells, while the right heatmap shows Z-score calculated in mutant condition. The Venn diagram shows overlap mutant and control peaks used in the analysis. h Scatter plot of Nrxn1 expression along pseudo time trajectory of AP_RGCs to ExN_DL in control (left) and mutant (right). i Differential gene regulation inside the ExN_DL cluster, each point represents a gene. Number of unique peaks associated to each gene, in each genotype, are plotted. Points in blue are downregulated genes, while those in red are upregulated. j Enhancer-promoter regulatory network inside the Nlgn1 gene locus (chr3: 25,425,522-26,444,634), magnifications in 1 and 2 show differential accessibility at two enhancers ExN_DL cluster. k Pseudo time density plot of AP_RGC to ExN trajectory. l Immunostaining in E14.5 developing cortex. SOX2 marks apical radial glia, TBR2 intermediate progenitors and DCX marks early neurons (statistic two-sided t-test, SOX2, Control vs Mutant, ***P < 0.001, n = 9 independent embryos for each group; TBR2, Control vs Mutant, ***P < 0.001, n = 7 embryos for each group; DCX, ***P < 0.001, n = 7 independent embryos for each group. Data are presented as mean values +/− SEM). Bar = 40 μm. m Schematic representation of in utero electroporation (IUE) experiment in E13.5 embryos, created with BioRender.com. RFP immunostaining on IUE brains (P10) with magnification on the right. Left bar = 50 μm; right bar = 10 μm.

