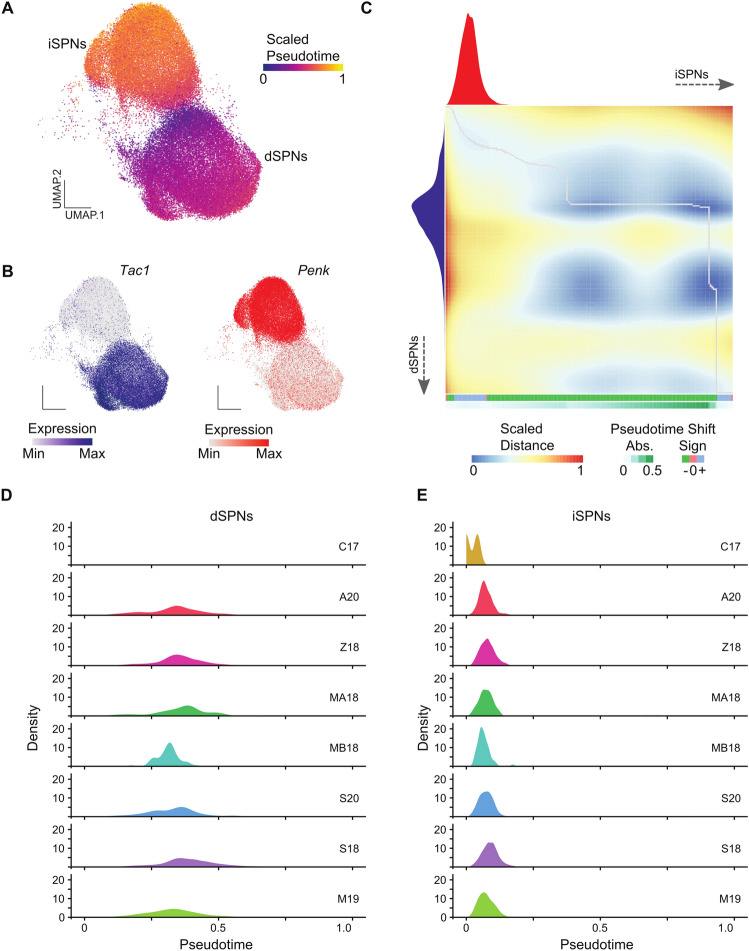
Figure 2.
Comparing pseudotime trajectory dynamics between dSPNs and iSPNs. (A) UMAP plot colored by PHATE pseudotime scale with (B) feature plots showing the expression of dSPN marker (Tac1) and iSPN marker (Penk). (C) Dissimilarity matrix and global alignment of pseudotime trajectories between dSPNs (x-axis) and iSPNs (y-axis) with pseudotime shifts labelled below. (D) Plots of Tac1 (dSPNs) or (E) Penk (iSPN) expression across pseudotime separated by dataset.

