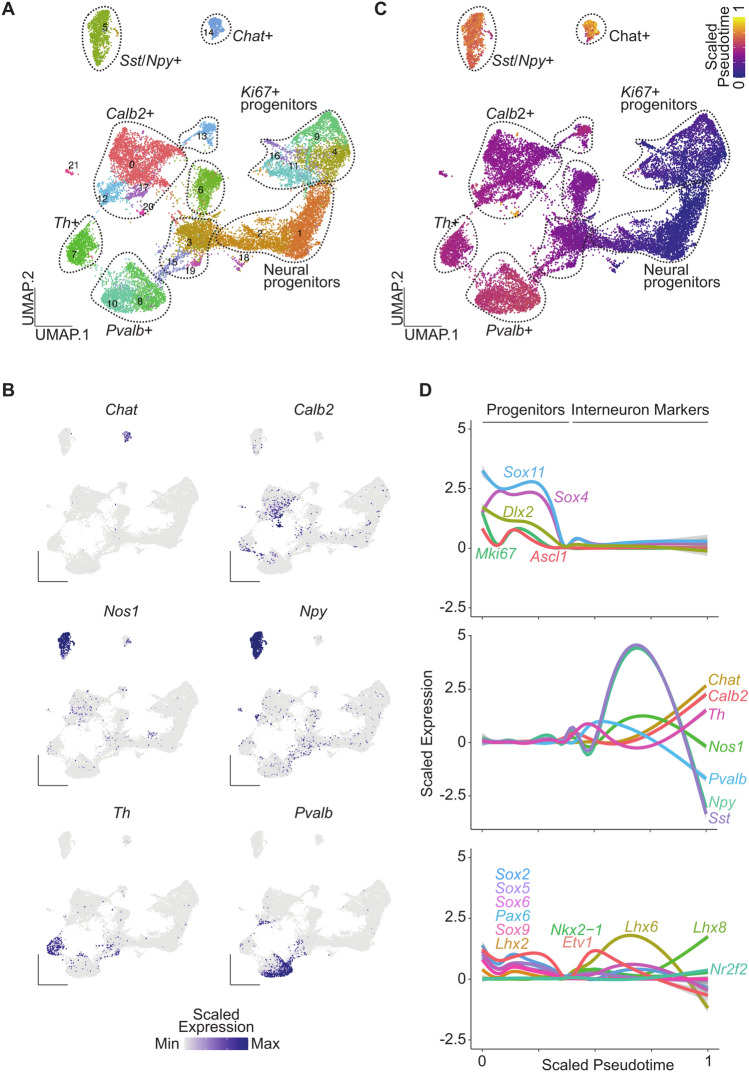
Figure 4.
Pseudotime analysis of striatal interneuron subtypes. (A) Annotated UMAP clusters of interneuron and neural progenitor clusters isolated from the integrated dataset. (B) Scaled expression of genes enriched in distinct interneuron populations. (C) UMAP of cells colored by PHATE pseudotime values. (D) Expression of progenitor markers (top panel), interneuron subtype markers (middle panel), and key transcription factor important for interneuron development (bottom panel) across pseudotime.

