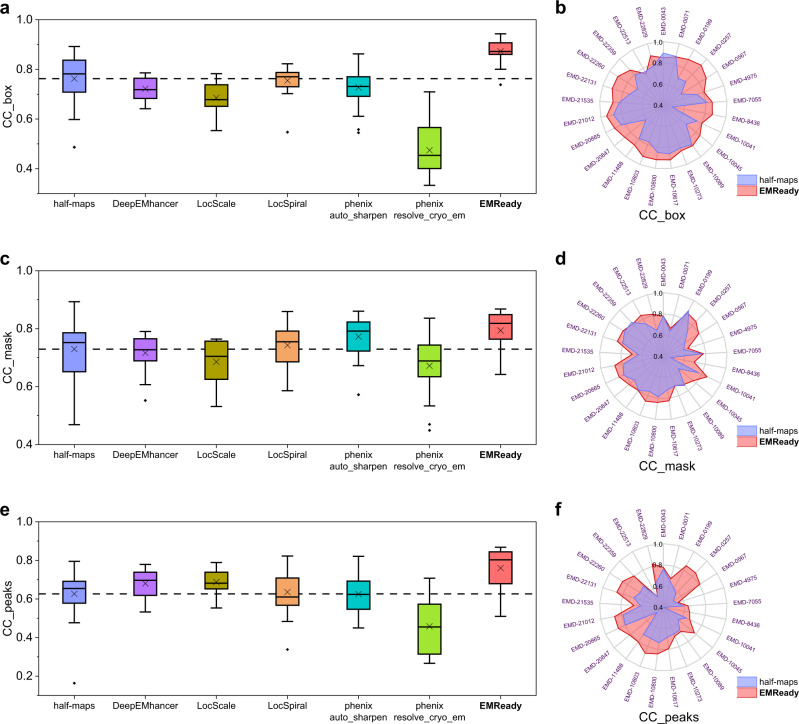
Fig. 6. Comparison of the CC values on the test set of 25 pairs of half-maps.
a, c, e Box-whisker plots of CC_box (a), CC_mask (c), and CC_peaks (e) for the average maps of half-maps, the maps processed by DeepEMhancer, LocScale, LocSpiral, phenix.auto_sharpen, phenix.resolve_cryo_em (density modification) and EMReady (n = 25 individual test cases). The center line is the median, the cross is the mean, lower and upper hinges represent the first and third quartile, the whiskers stretch to 1.5 times the interquartile range from the corresponding hinge, and the outliers are plotted as diamonds. Dashed lines stand for the average CC values of deposited half-maps. b, d, f Comparison of CC_box (b), CC_mask (d), and CC_peaks (f) between the deposited map and EMReady-processed map on each test case. Source data are provided as a Source Data file.

