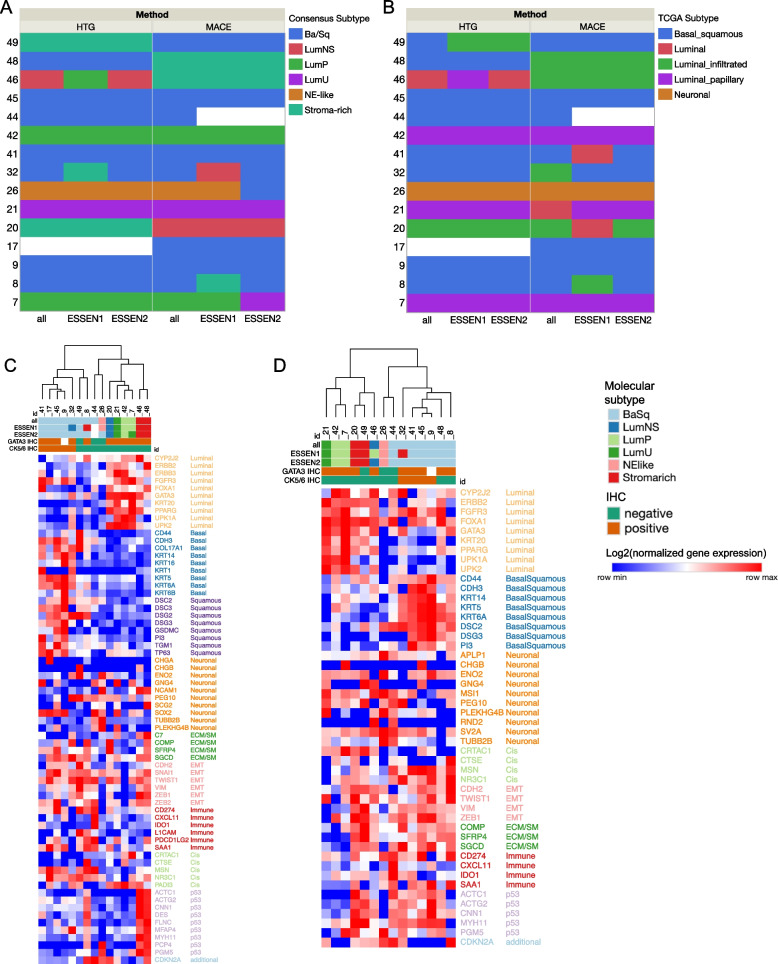
Fig. 3.
Heatmap showing the molecular subtypes according to the consensus classification (A) and the TCGA classification (B) for each sample as identified by all genes vs. different gene sets (all, ESSEN1, ESSEN2) and assay methods (HTP, MACE). C: Gene expression heatmap of MACE data and the ESSEN1 panel. D: Gene expression heatmap of the ESSEN2 panel with molecular consensus classes assigned using the HTP data. The heatmap was constructed with the open-source Morpheus software (https://software.broadinstitute.org/morpheus/) using log2-transformed normalized gene expression values. Hierarchical clustering was performed with Pearson’s correlation metric with complete linkage. Heatmaps also indicate the IHC-expression of CK5/6 and GATA3. Colors of genes correlate to the signature names. CIS: carcinoma in situ; ECM: extracellular matrix; EMT: epithelial-to-mesenchymal transition; SM: smooth muscle

