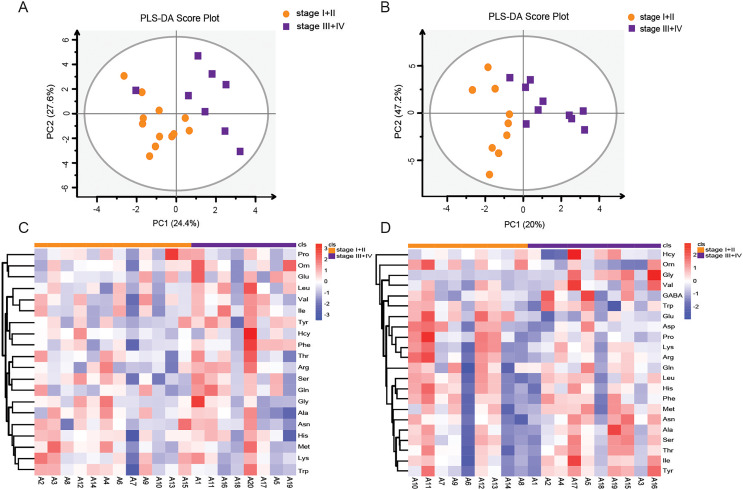
Figure 5. Amino acid profiling of the plasma and tissue samples between stage I+II and stage III+IV patients according to the TNM staging system.
PLS-DA scores of amino acids in plasma (A) and tissue (B) samples between LSCC stage I+II and stage III+IV patients. Overall heatmap of amino acids in plasma (C) and tissue (D) samples between LSCC stage I+II and stage III+IV patients.

