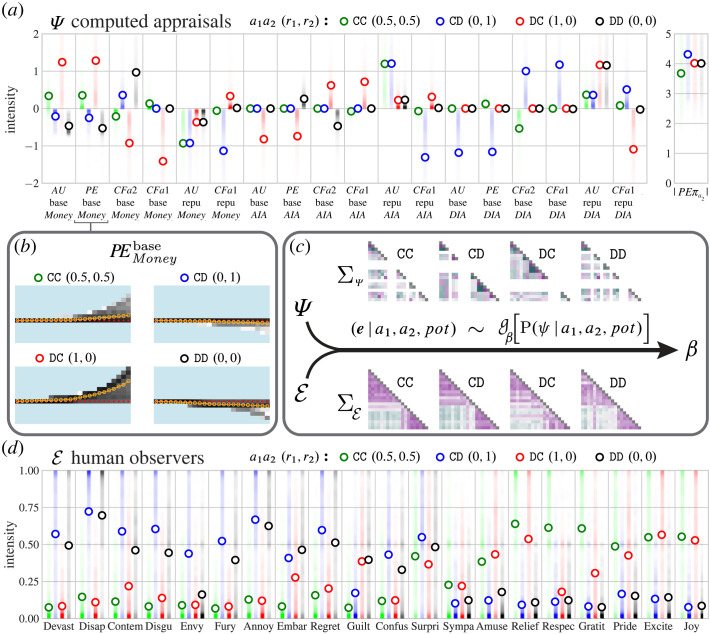
Figure 3.
Generative structure. (a) Expectations and densities of the normalized computed appraisals. is the matrix of the 19-dimensional appraisal vectors. The legend gives the relative payoffs to the players (), e.g. when player 1 Cooperated and won nothing because player 2 Defected and won the whole pot, : . Colour indicates the outcome of the games. (b) Example of a computed appraisal’s relationship to pot size. The -axis shows the 24 pot sizes (non-parametric scaling), -axis shows the loading on simulated players’ monetary utility prediction error, colour indicates density. (c) We learn a function () that transforms computed appraisals () into emotion predictions () by scoring the empirical emotion vectors predicted for the GenericPlayers from the joint posterior over computed appraisals. To learn the transformation parameters, we leverage the expectations, as well as the hierarchical covariance structure of computed appraisals and of empirical emotion attributions. The result is a sparse weights matrix . Expectations are shown in (a,d). Correlation matrices shown in (c) give the within-stimulus correlation (averaged within outcome) between computed appraisals (top) and between empirical emotion predictions (bottom). (d) Emotion predictions for the GenericPlayers. Circles show the expected intensity for each outcome, summing over pot sizes and the eight photos. Shading shows the density of judgements. is the matrix of the 20-dimensional emotion prediction vectors. Each expectation (and associated distribution) reflects judgements of observers.

