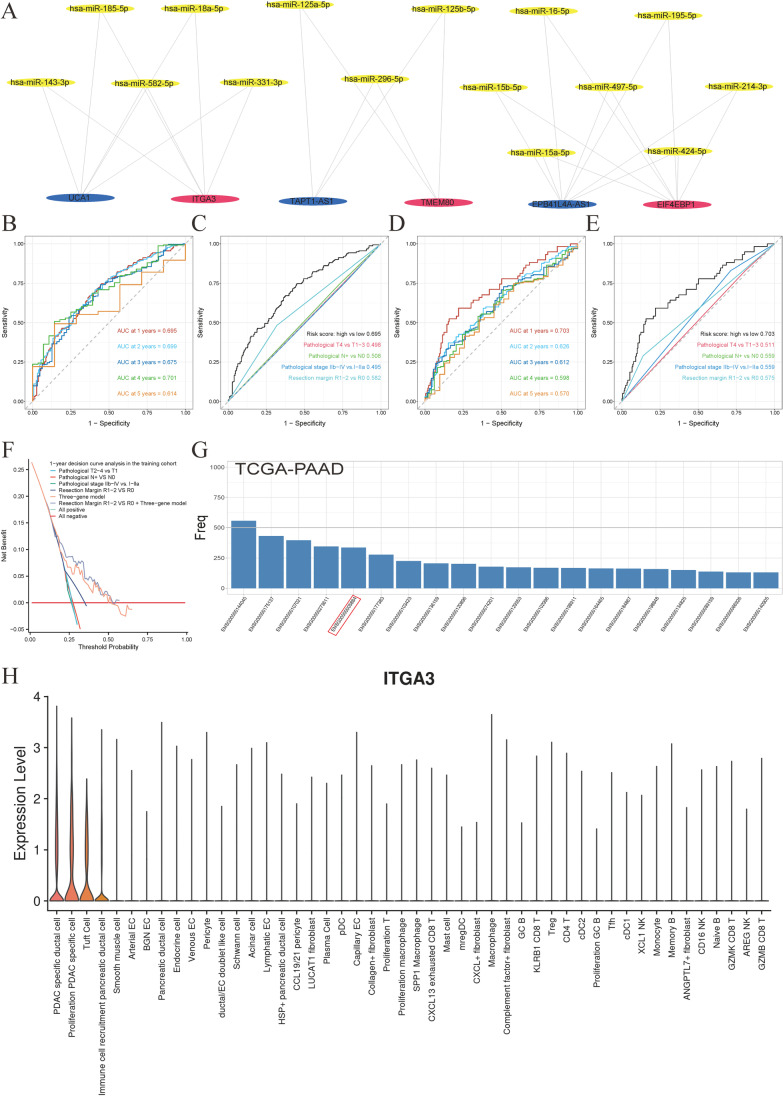
Fig. 6.
Prognosis-related purity-independent three-gene network visualization. A Purity-independent regulatory network constructed using 3 prognosis-related mRNAs, 15 miRNAs, and 3 lncRNAs. B Time-dependent receiver operating characteristic (ROC) curves of the construction group (n = 540) for overall survival prediction using the three-gene model. C One-year time-dependent ROC curves for overall survival, showing higher area under the curve (AUC) values for the three-gene model compared to other clinic al factors in the validation groups (n = 288). D Time-dependent ROC curves of the validation group (n = 288) for overall survival prediction using the three-gene model. E One-year time-dependent ROC curves for overall survival, demonstrating higher AUC values for the three-gene model compared to other clinical factors in the validation groups (n = 288). F Decision curve analysis of the three-gene model, clinical models, and the combined model at 12 months post-pancreatectomy in the construction group (n = 540). G Frequency count of variables selected using the LASSO algorithm, repeated 1000 times in The Cancer Genome Atlas (TCGA) using BLASSO (n = 160). H Violin plot of ITGA3 expression constructed using the single-cell pancreatic cancer dataset of Peng et al. Cell types are arranged from left to right based on decreasing ITGA3 expression (n = 35)

