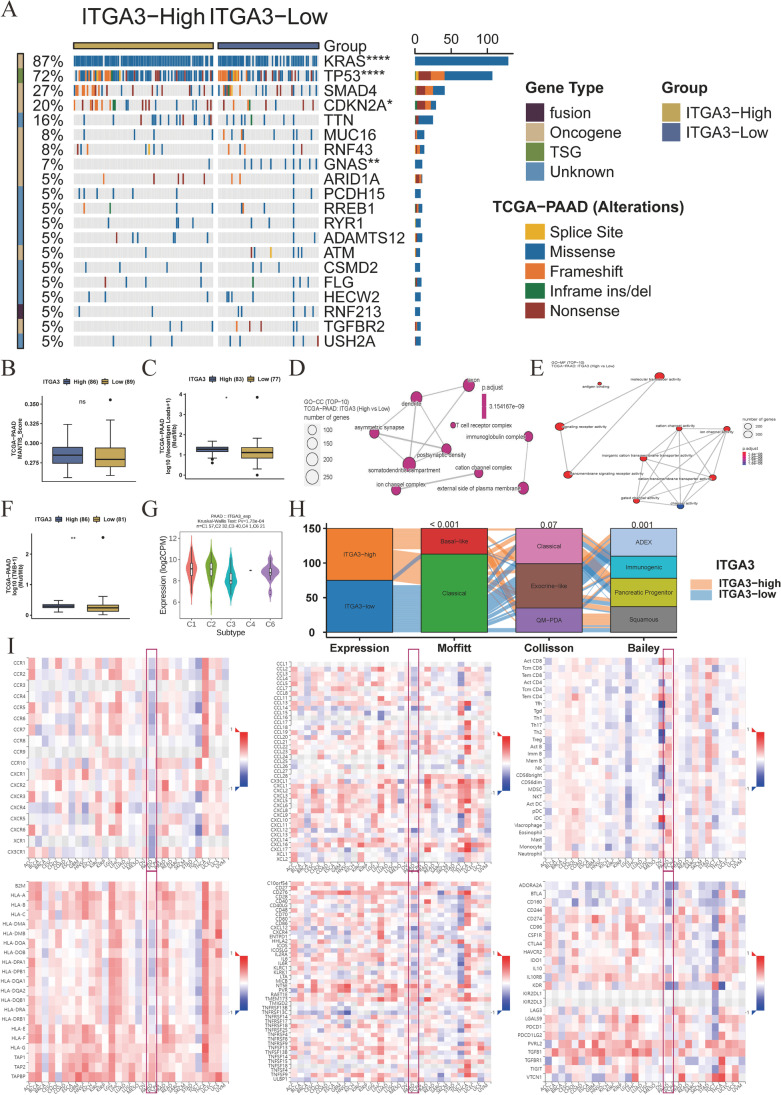
Fig. 7.
Association of ITGA3 with genomic and molecular characteristics of pancreatic cancer. A Mutation landscape of the ITGA3-high and ITGA3-low expression groups. The Fisher’s exact test was used to determine statistical differences between groups (n = 175). B Microsatellite Analysis for Normal-Tumor InStability (MANTIS) scores in the ITGA3-high and ITGA3-low groups (n = 175). C Neoantigen loads in the ITGA3-high and ITGA3-low groups (n = 160). D Gene Ontology (GO) analysis of cell component (CC) in the ITGA3-high and ITGA3-low groups (n = 179). E GO analysis of molecular function (MF) in the ITGA3-high and ITGA3-low groups. Adjusted P values were calculated using the one-sided Fisher’s exact test and corrected for multiple hypotheses using the Benjamini–Hochberg false discovery rate (FDR) of 5% (n = 179). F Tumor mutation burden (TMB) in the ITGA3-high and ITGA3-low groups (n = 167). G Differential expression of ITGA3 among immune subtypes (n = 151). H High expression of ITGA3 in common molecular subtypes, including Moffit basal subtypes, Collisson quasimesenchymal subtypes (QM-PDA), and Bailey squamous subtypes. Differences between groups were assessed using the chi-square test (n = 150). I Spearman’s correlation analysis between ITGA3 and receptors, chemokines, tumor-infiltrating lymphocytes, MHC molecules, immune stimulators, and inhibitors in pan-cancer analysis. Blue squares indicate negative correlations, while red squares indicate positive correlations; darker colors indicate stronger correlations (n = 179). B, C, F, and G: Data represented as boxplots, and differences in immune-related scores or immune cells were compared using the Mann–Whitney U test. Boxes represent interquartile ranges, horizontal lines within each box represent the median, and whiskers represent values 1.5 times the interquartile range. Black dots indicate outliers. Statistical significance is indicated as follows: *P < 0.05, **P < 0.01, ***P < 0.001, and ****P < 0.0001

