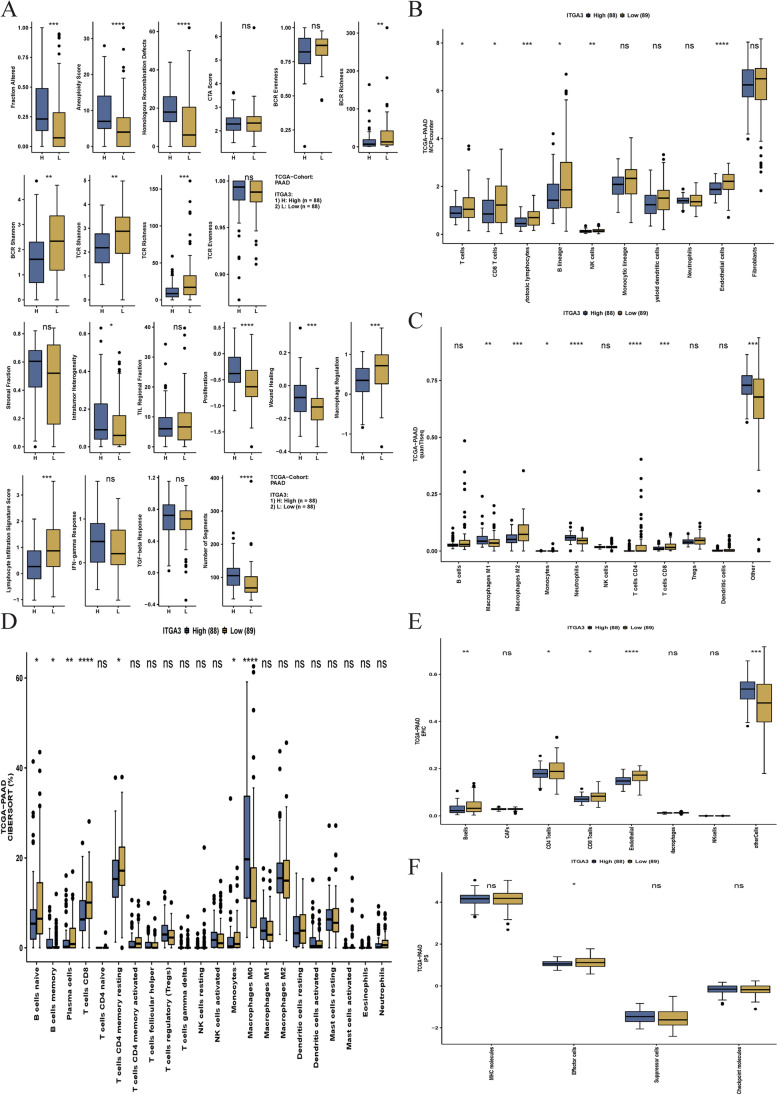
Fig. 9.
Effect of ITGA3 expression on immune response pathways and cell composition in pancreatic cancer tissue. A Gene set variation analysis (GSVA) comparing immune response pathways in ITGA3-high and ITGA3-low groups (n = 176). B–E Deconvolution results of cell components using bulk RNA sequencing with The Cancer Genome Atlas-pancreatic ductal adenocarcinoma (TCGA–PAAD) dataset (n = 177). Cell composition analyzed using MCPcounter (B), quanTIseq (C), CIBERSORT (D), EPIC (E), and IPS (F) in samples with high and low ITGA3 expression. Boxplots illustrate the data, and the Mann–Whitney U test was used to compare immune-related scores or immune cells. Boxes represent the interquartile range, horizontal lines represent the median, and whiskers indicate values 1.5 times the interquartile range. Outliers are depicted as black dots. Note: ns no significance; *P < 0.05, **P < 0.01, and ***P < 0.001

