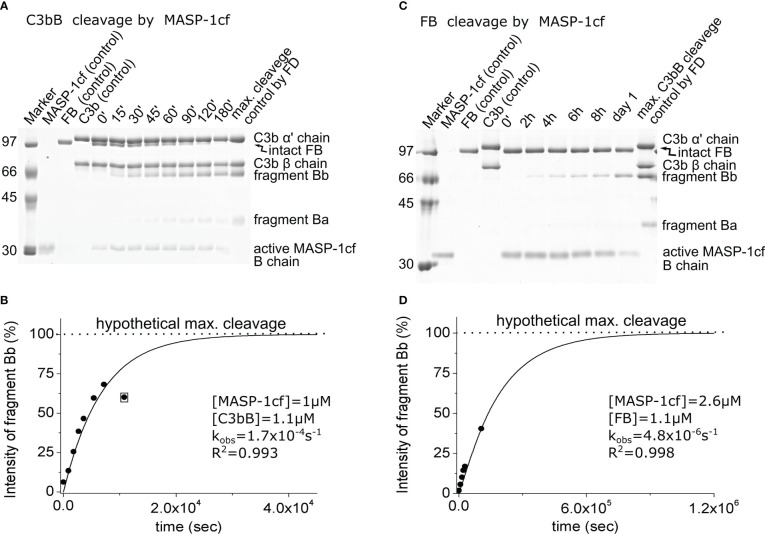
Figure 4.
Cleavage of C3bB or FB by MASP-1cf. (A) The cleavage reaction of C3bB (substrate) by MASP-1cf was performed at 37°C and monitored by SDS-PAGE under reducing conditions as described in the Materials and methods. (B) Densitometric analysis was performed to determine the intensities of the FB cleavage product (Bb) bands on the gel in panel (A). The hypothetical Bb maximal intensity value was derived from a control reaction between FD and C3bB. The determined intensities were normalized to the value of the maximal cleavage control and plotted as its percentages. The observed rate constant (kobs) was determined by exponential fit as described in the Materials and methods. An outlier data point, indicated by boxing, was excluded from the data set during the fit. (C) Cleavage of free FB (substrate) by MASP-1cf was performed at 37°C and monitored by SDS-PAGE under reducing conditions as described in the Materials and methods. A longer examination was not feasible due to the autodegradation of MASP-1cf. (D) Densitometric analysis of the gel in panel (C) was performed as described for panel (B). A typical experiment of each type is presented here. Averages and the number of parallels are listed in Table 2.

