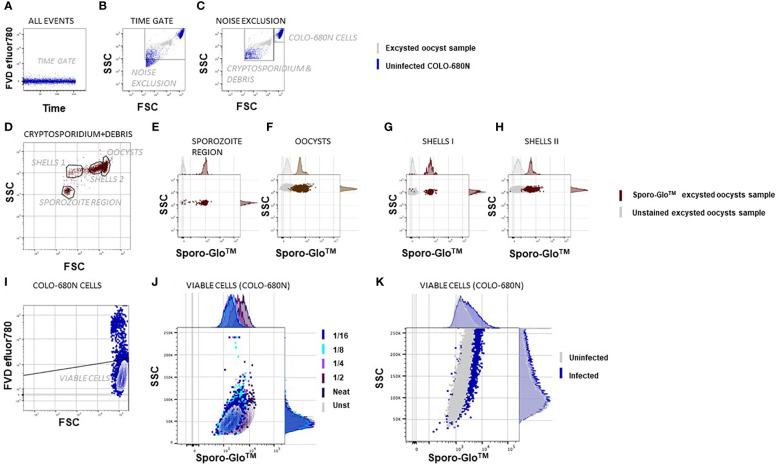
Figure 1.
Flow cytometric Cryptosporidium infectivity assay detects infected COLO-680N cells at the same time as oocysts, sporozoites, and shells from Cryptosporidium using anti-Spor FITC. The samples were fixed, permeabilized, and stained with Sporo-Glo™ FITC as indicated. The population shown on the graph is indicated above each dot plot, and the populations/regions defined on dot plots are shown and labeled within the dot plot/contour plot. (A) A time gate verifies stream stability. (B) Excysted oocyst sample in gray and uninfected COLO-680N sample in blue overlaid to show the noise exclusion gate, which removes the debris of smaller side scatter signals than the smallest Cryptosporidium particles. (C) A region that captures COLO-680N cells is distinct from a region that captures Cryptosporidium and debris. (D) Four populations are evident based on unique FSC and SSC signals within the Cryptosporidium and debris region. (E) Particles in the sporozoite region stain clearly with Sporo-Glo™ FITC at 1/16 dilution. (F) Oocysts stain with the same concentration of anti-Spor FITC. (G, H) Two regions defined as shells—or empty oocysts—stain with anti-Spor FITC. (I) Viable COLO-680N cells are defined using FVD efluor780. (J) A titration of anti-Spor FITC on uninfected COLO-680N cells to capture the dilution with minimal background staining shows that 1/16 gives a similar signal intensity to unstained cells. (K) Infected COLO-680N cells stain with anti-Spor FITC.

