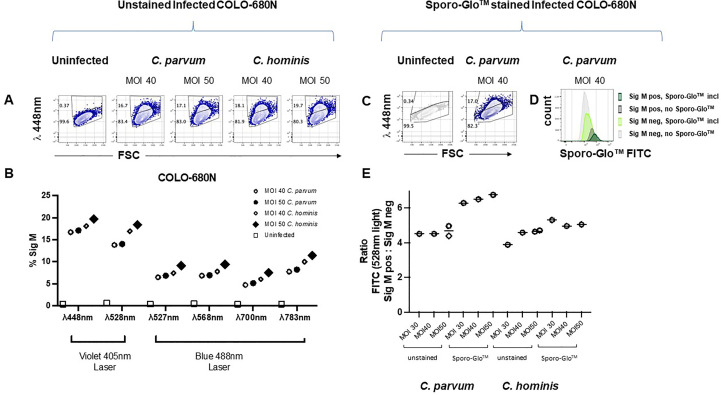
Figure 4.
Fixed but completely unstained COLO-680N cultures infected with C. parvum and C. hominis contain a population of cells with a naturally auto-fluorescent profile (Sig M) that is absent from uninfected cultures. For each infection condition indicated, Sig M-positive cells are detected in infected cultures using a 448/45 BP filter with 405-nm excitation (A). Percent of Sig M-positive cells from infected and uninfected completely unstained cultures captured with a range of fluorescent filters (448/45 BP filter with 405-nm excitation, 528/45 BP filter with 405-nm excitation, 527/32 BP filter with 488-nm excitation, 568/42 BP filter with 488-nm excitation, 700/54 BP with 488-nm excitation, and 783/56 BP filter with 488-nm excitation) show that Sig M is detectable across a broad range of wavelengths (B). Fixed, permeabilized, and fully stained COLO-680N cultures (Sporo-Glo™ FITC, FVDefluor780) contain a population of Sig M-positive cells identifiable with 448/45 BP filter with 405-nm excitation from infected cultures—uninfected and C. parvum MOI 40 shown (C). Comparing the fully stained and unstained infected cultures for FITC signal shows that Sporo-Glo™ staining increases the strength of FITC signal when compared with unstained infected cultures—C. parvum MOI 40 shown (D). The ratio of FITC/lambda 528-nm light for Sig M high cells vs. Sig M low cells demonstrates a small increase in favor of a specific Sporo-Glo™ FITC signal for C. parvum-infected cultures, while the C. hominis-infected cultures may show a similar ratio regardless of Sporo-Glo™ staining (E).

