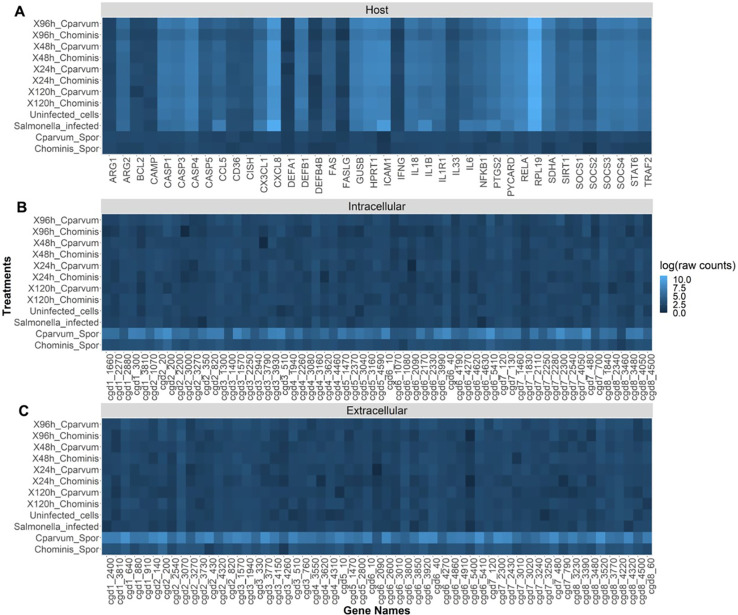
Figure 6.
Heat map showing the relative abundance (log of raw counts) of each mRNA transcript (gene names) in each sample (treatments). (A) Expression of host (human) genes. (B) Cryptosporidium genes thought to be expressed at high levels intracellularly. (C) Cryptosporidium genes thought to be expressed at high levels extracellularly.

