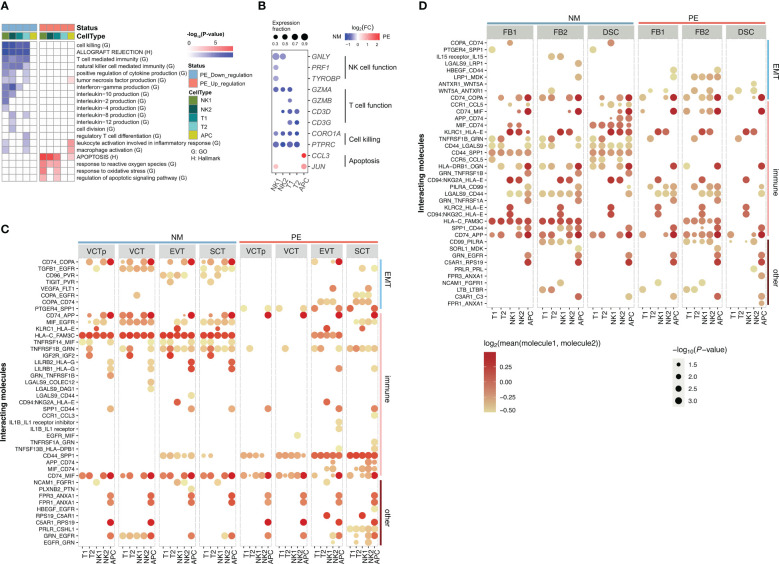
Figure 4.
Characterization of genes in decidual immune cells that are differentially expressed in between LOPE and normal samples and Characterization of ligand-receptor interactions of decidual immune cells with placental trophoblasts and with decidual core cells in LOPE and normal samples. (A) Enrichment results of DEGs in decidual immune cells. (B) Dot plot showing that expression patterns of selected marker genes representing some of the enriched GO/HALLMARK terms in different types of decidual core cells. Note that the organizations and settings in (A, B) are the same as that in Figures 2A, B . (C) The ligand- receptor interactions identified in between decidual immune cells and placenta trophoblasts in PE and in normal samples. (D) The ligand- receptor interactions identified in between decidual immune cells and decidual core cells in PE and in normal samples. In (C, D), the size of a circle represents the P-value of the corresponding interaction determined by CellPhoneDB, and the color of the circle represents the mean of the average expression level of the interacting molecule.

