Figure 1.
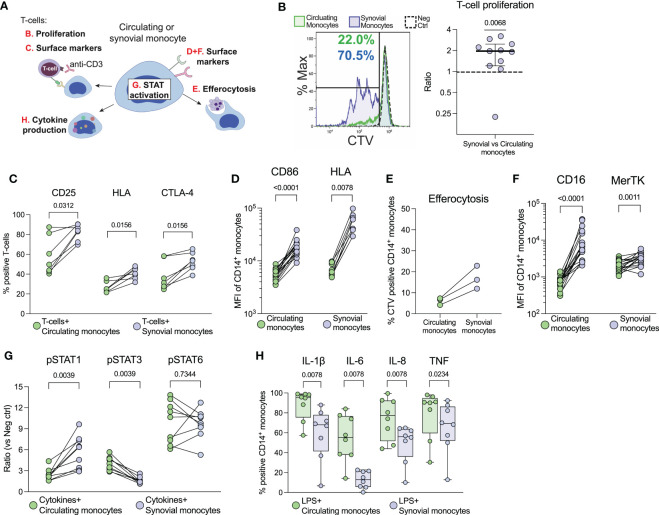
Synovial monocytes from patients with oJIA induce T-cell proliferation, display increased efferocytosis and a resistance to further activation. (A) Schematic overview of the various analyses of synovial- vs. circulating monocytes. (B) T-cells were isolated from healthy controls and stained with CellTrace Violet (CTV). They were subsequently activated with anti-CD3 and co-cultured with isolated monocytes for 72hrs, before being analysed for proliferation (presented as the ratio of percent proliferation induced by synovial- vs. circulating monocytes, line at median with IQR, n=11) and (C) expression of activation markers on T-cells by flow cytometry (n=7). (D) Shows expression of markers related to antigen presentation on monocytes [CD86 (n=17) and HLA (n=8)]. (E) As a measurement of clearance, isolated monocytes were incubated with CTV-stained apoptotic neutrophils (n=3), and the percent of CTV-positive CD14+CD66b- monocytes is presented (reflecting uptake of neutrophils). (F) Shows expression of markers related to clearance on monocytes (CD16 and MerTK, n=17). (G) Monocytes in synovial fluid or blood were activated with IFNγ, IL-4 and IL-6 and investigated for their phosphorylation response of STATs (n=9). Values represent the ratio between stimulated vs. unstimulated samples. (H) Cytokine production of monocytes was studied intracellularly by incubation with golgiplug, followed by LPS activation (n=8). Statistics were performed using one sample Wilcoxon signed-rank test (with the hypothetical median of 1) or Wilcoxon matched pairs signed rank test. oJIA, Oligoarticular juvenile idiopathic arthritis; MFI, Median fluorescence intensity; IFN, Interferon; IL, Interleukin; STAT, Signal transducer and activator of transcription; CTV, Cell Trace Violet; LPS, Lipopolysaccharide; TNF, Tumour necrosis factor.

