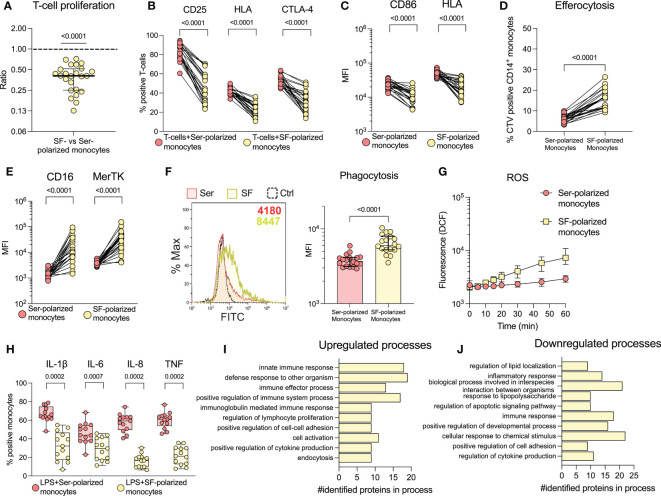
Figure 2.
Synovial fluid induces a regulatory phenotype in healthy monocytes and downregulates co-stimulatory capabilities. Monocytes were isolated from healthy controls and polarized with 20% serum (Ser) or 20% synovial fluid (SF) overnight. Polarized monocytes were co-cultured with CellTrace violet (CTV) stained healthy CD3-activated T-cells and analysed by flow cytometry for (A) proliferation (n=24, data is presented as the ratio of proliferation induced by SF-polarized monocytes vs. serum-polarized monocytes) and (B) activation markers on T-cells (n=24). (C) Shows expression of CD86 and HLA in monocytes (n=24). (D) Monocytes were incubated with CTV-stained apoptotic neutrophils and analysed for uptake of these cells. The percentage of CTV positive CD14+CD66b- monocytes is shown (n=21). (E) Displays the expression of CD16 and MerTK in monocytes. (F) Phagocytosis of polarized monocytes was assessed following incubation with opsonized FITC labelled beads (n=18). (G) ROS production of polarized monocytes stained with H2DCFDA at different time points (n=24, median with interquartile range). (H) Cytokine production of polarized monocytes was studied intracellularly following LPS activation (n=13). Changes in monocyte proteomics were analysed (n=3) through biological process enrichment, and the top 10 (I) upregulated and (J) downregulated processes following polarization are presented. Statistical analyses were performed using one sample Wilcoxon signed-rank test (with the hypothetical median of 1) or Wilcoxon matched pairs signed rank test. Lines at median with IQR. MFI, Median fluorescence intensity; IL, Interleukin; CTV, Cell Trace Violet; LPS, Lipopolysaccharide; ROS, Reactive oxygen species; TNF, Tumour necrosis factor.

