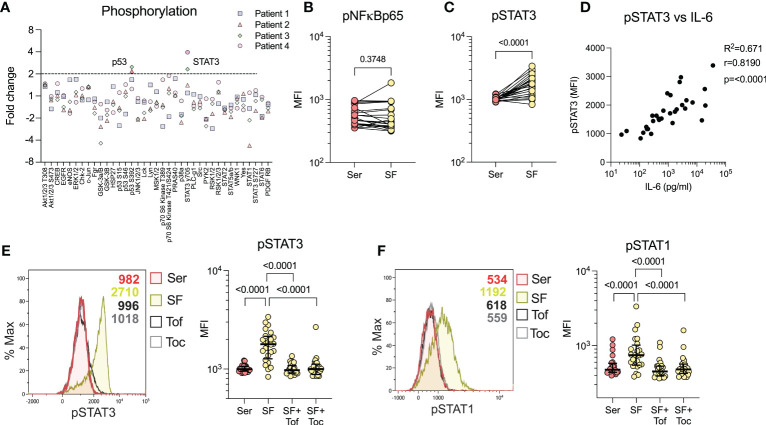
Figure 3.
Synovial fluid predominately induces STAT3 phosphorylation through IL-6. (A) Broad spectrum phosphorylation array of 37 kinases following 20% synovial fluid (SF) stimulation of healthy monocytes compared to serum (n=4). (B) Analysis of NFkBp65 phosphorylation with SF vs. serum (Ser) stimulation by flow cytometry (n=24). (C) Analysis of STAT3 phosphorylation with SF (n=24) by flow cytometry. (D) Shows correlation between levels of STAT3 phosphorylation in monocytes versus IL-6 in the SF (n=33, Spearman correlation). (E) SF stimulation and STAT3 phosphorylation analysis, with pre-treatment of monocytes with tofacitinib (1µM) or tocilizumab (100ng/ml) and (F) STAT1 phosphorylation (n=24). Data is presented as median with IQR. MFI, Median fluorescence intensity; IL, Interleukin; STAT, Signal transducer and activator of transcription; Tof, Tofacitinib; Toc, Tocilizumab.

