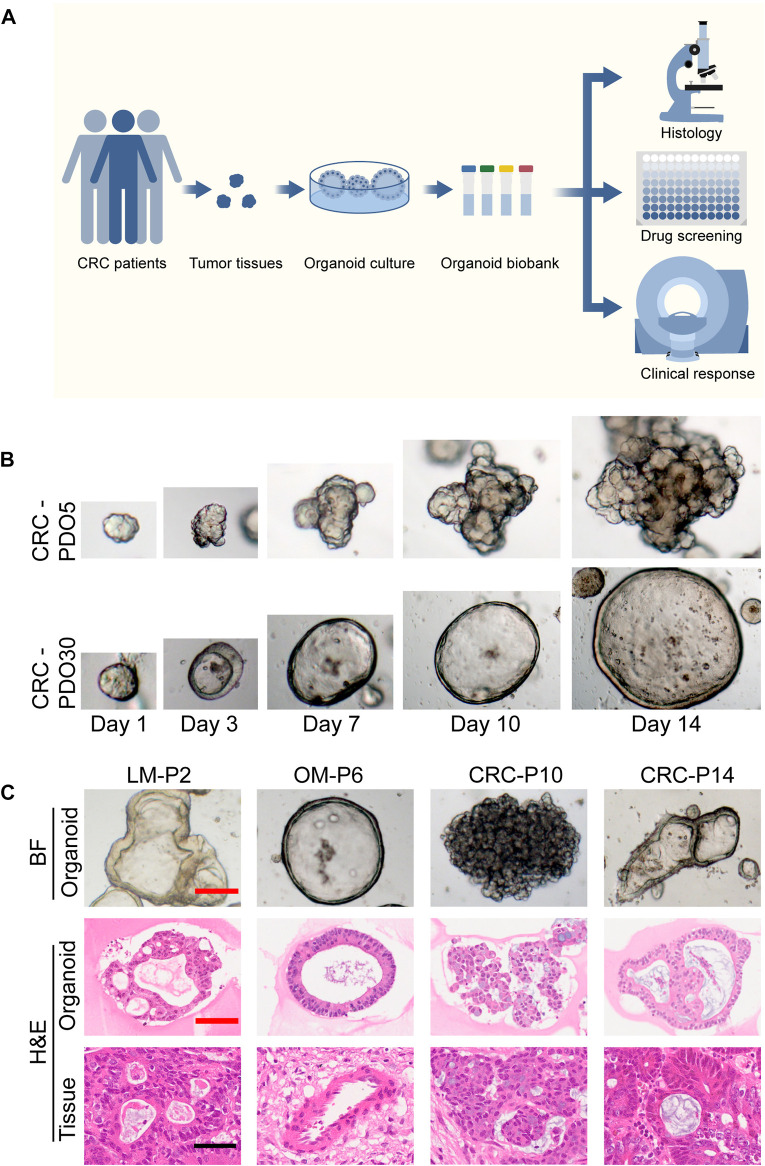
FIGURE 1.
Establishment of a biobank of mCRC PDOs. (A) Flow diagram of the study, including the establishment of mCRC organoid lines, as well as the histological characterization, drug screen on organoids. (B) Time course culture of mCRC organoids with different morphologies (CRC-PDO5, irregular solid/compact structures; CRC-PDO30, thin-walled cystic structures). (C) Histopathological features of primary tumors and PDOs. H&E comparison of four CRC organoids (LM-P2, OM-P6, CRC-P10, and CRC-P14) with the corresponding tumor from which they were derived (4 mCRC patients). Representative images of these CRC organoids in bright-field were displayed (top). Black scale bar, 100 μm. Red scale bar, 50 μm. PDOs, patient-derived organoids; mCRC, metastatic colorectal cancer; LM, liver metastasis; OM, ovarian metastasis.

