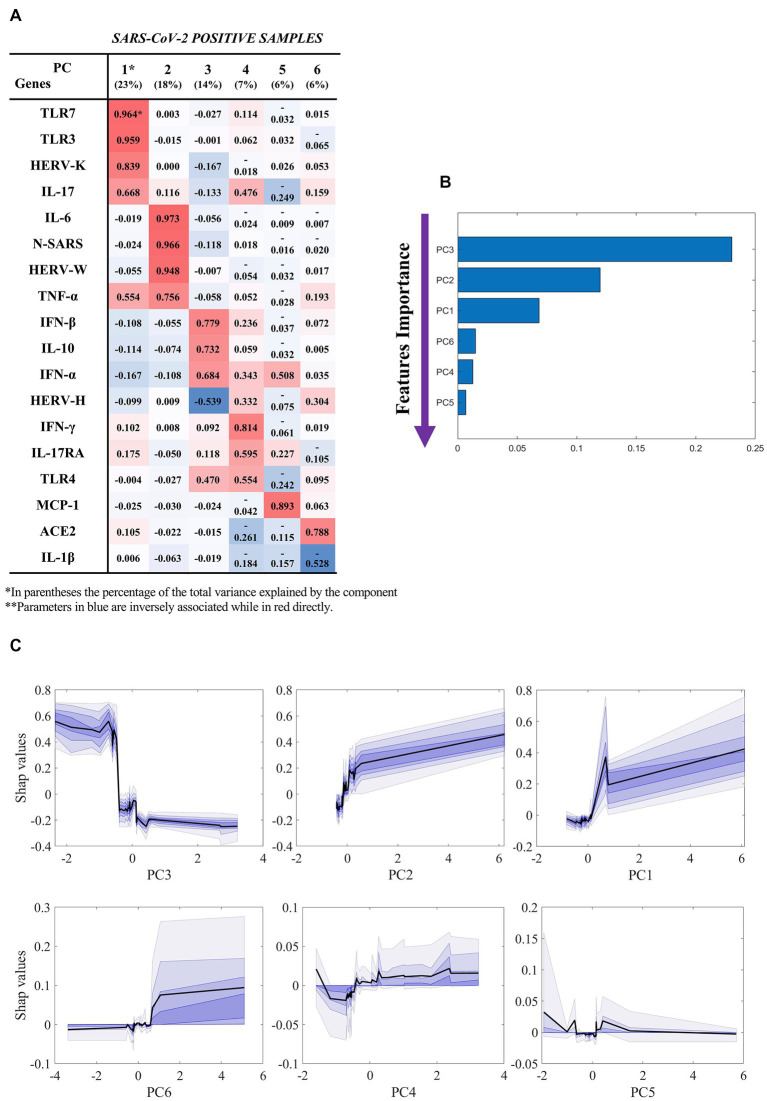
Figure 2.
Results of the machine learning model (hospitalized vs not hospitalized SARS-CoV-2-positive). Based on the results of factor analysis. (A) Cumulative variance and single loadings computed through factor analysis; (B) feature importance ranking derived through SHAP values; (C) SHAP dependence plots for each component, showing median and confidence intervals across 100 repetitions, in black and violet, respectively. Summary of classification performance: AUC 0.85 ± 0.12; Accuracy 0.90 ± 0.08; Sensitivity 0.98 ± 0.05; Specificity 0.73 ± 0.22; f1-score 0.80 ± 0.18; PPV 0.94 ± 0.13; NPV 0.90 ± 0.08.

