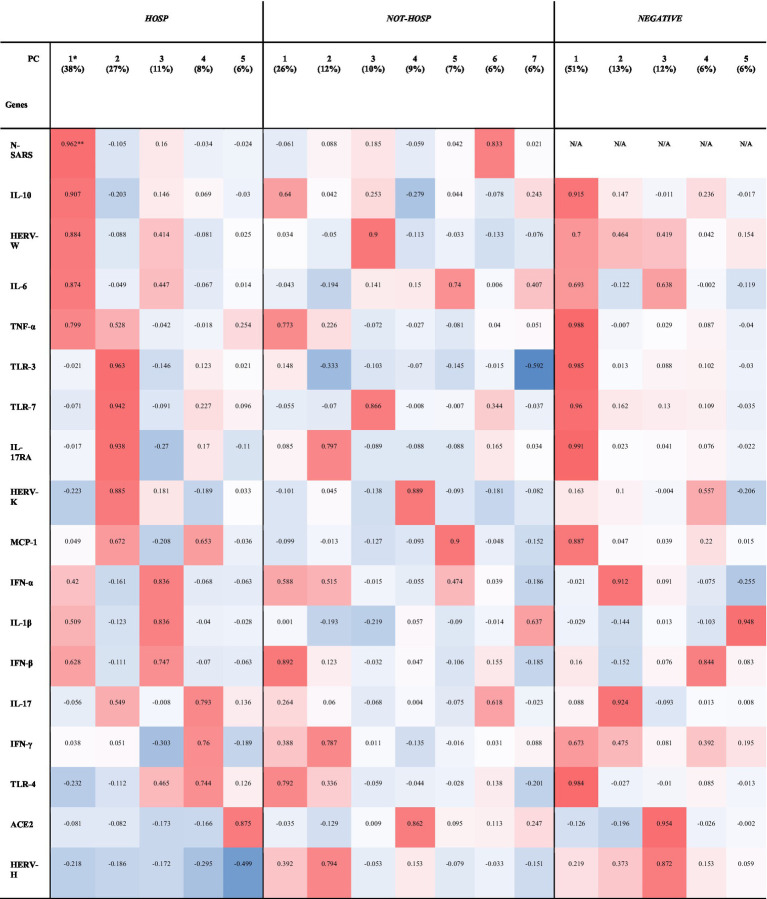
Table 2.
Principal components (PC) and hierarchical clustering of HERVs, inflammatory mediators, and SARS-CoV-2 infection-related genes in SARS-CoV-2-positive (HOSP and NOT-HOSP) and -negative nasopharyngeal and oropharyngeal swabs.

|
*In parentheses the percentage of the total variance explained by the component. **Parameters in blue are inversely associated while those in red are directly associated.
