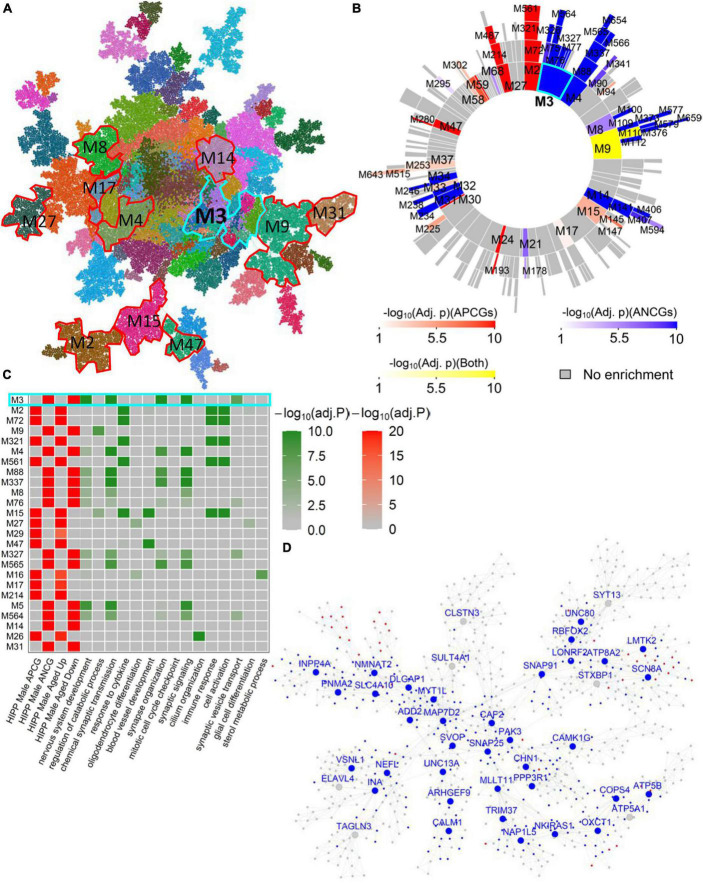
FIGURE 3.
Male-specific aging-associated co-expression network in the hippocampus. (A) The global MEGENA network from the male hippocampus. Each color indicates a highly connected module. The top age-associated modules enriching for the ACGs and DEGs of the male hippocampus are highlighted with red and cyan frames. (B) Sunburst plot of the multi-scale modules in the male hippocampus network. Red blocks show the modules enriched for APCGs of the male hippocampus; blue blocks show the modules enriched for ANCGs of the male hippocampus; yellow blocks show the modules enriched for both APCGs and ANCGs. (C) Heatmap of the top 25 modules in the male hippocampus network enriched with ACGs. The left panel shows the adjusted p-values of ACG and DEG enrichments of the 25 modules. The right panel shows the adjusted p-values of enrichment for the top 2 Gene Ontology biological processes in each of the 25 modules. (D) Subnetwork of the top age-associated module Hippocampus-Male-M3. Nodes with blue labels are ANCG hub genes in the male hippocampus. Red and blue nodes are up- and down-regulated genes in aged males versus young males, respectively.

