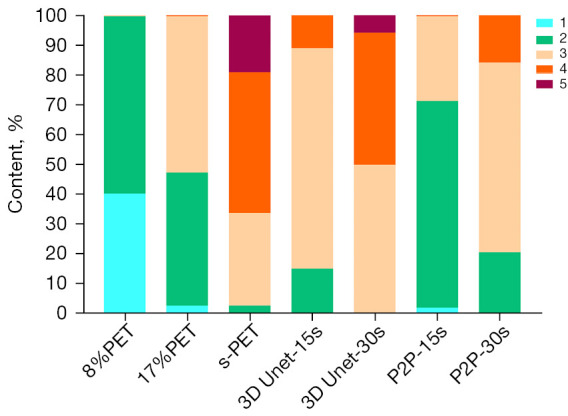
Figure 4.

Distribution of image quality assessments. X-axis represents image grouping obtained by multiple image reconstruction methods. Taking the 15 s PET image as input, the reconstructed image is recorded as 3D Unet-15s/P2P-15s. Similar to the above recording method, another set of images is recorded as 3D Unet-30s/P2P-30s; Y-axis represents the percentage of each score in each group; the legend in the upper right corner represents scores of 1–5. PET, positron emission tomography; s-PET, standard positron emission tomography (per bed time: 90 s); 3D Unet, a deep network model based on CNN; P2P, Pixel2Pixel deep network model based on GAN; CNN, convolutional neural network; GAN, generative adversarial network.
