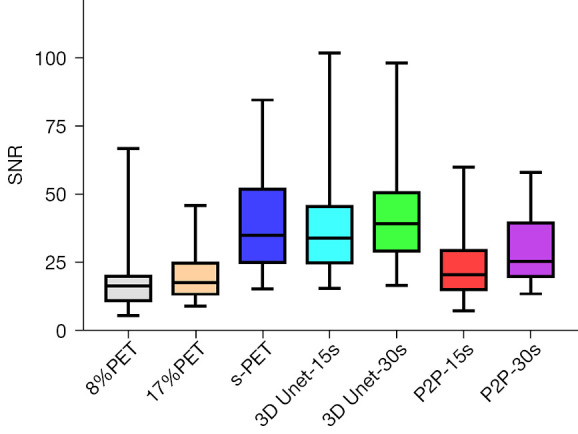
Figure 7.

Comparison of SNRs in tumor lesions between multiple groups. SNRs, signal-to-noise ratios; 3D Unet, a deep network model based on CNN; P2P, Pixel2Pixel deep network model based on GAN; PET, positron emission tomography; s-PET, standard positron emission tomography (per bed time: 90 s); CNN, convolutional neural network; GAN, generative adversarial network.
