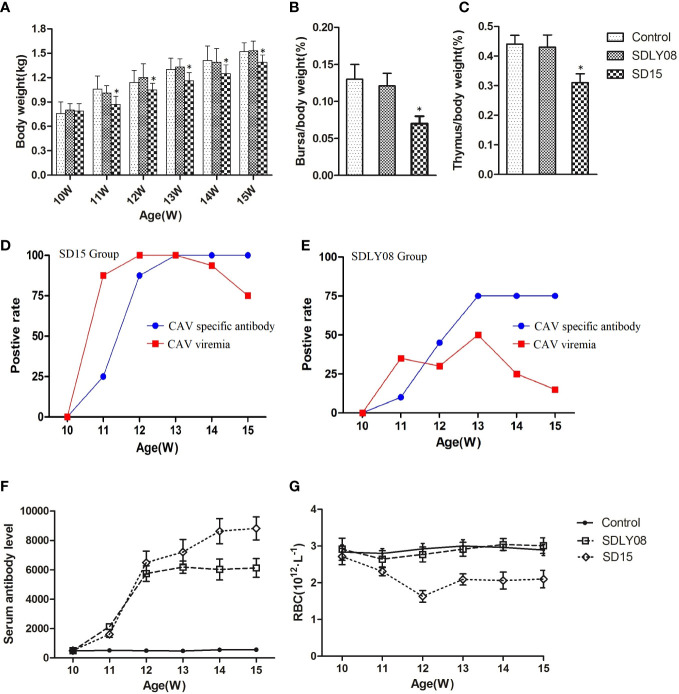
Figure 7.
Animal experiment indices of infected chicks and uninfected controls. (A) The body weights of chickens in each group. (B, C) Average bursa and thymus were calculated as organ weight (g)/BW (g) x 100%. (D, E) The positive rate of CAV viremia and CAV specific antibody of blood samples in the SD15 and SDLY08 groups. (F) CAV specific antibody titers in each group. (G) The number of RBC in each groups. *Indicates significant difference (P< 0.05) based on Duncan’s multiple-range test.

