FIGURE 5.

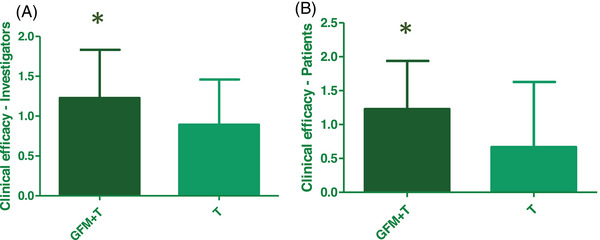
Mean score of global clinical efficacy evaluated by: (A) investigators (Group A, n = 44; Group B; n = 28) and (B) patients (Group A, n = 44; Group B, n = 27). *p < 0.05.

Mean score of global clinical efficacy evaluated by: (A) investigators (Group A, n = 44; Group B; n = 28) and (B) patients (Group A, n = 44; Group B, n = 27). *p < 0.05.