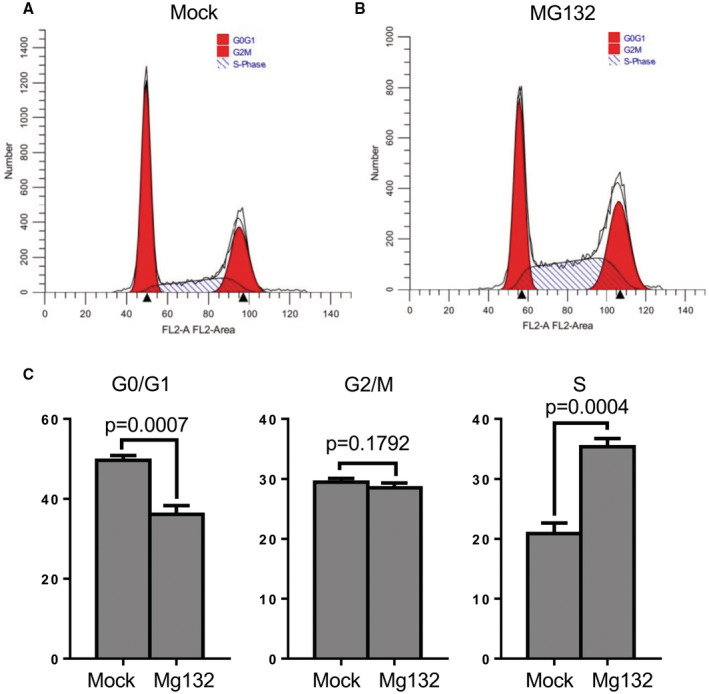
Figure EV1. Effect of MG132 on cell cycle.

-
A–CRPE‐1 cells were treated with either DMSO (Mock‐treated, A) or MG132 (B) for 4 h, fixed with 70% ethanol at 4°C, stained with Telford reagent at 4°C overnight, and subjected to a flow cytometry cell cycle assay. The percentage of cells in G1/G0, G2/M, and S phase are presented as bar graphs in (C). After normal distribution was determined by the Shapiro–Wilk normality test, statistical significance was calculated with an unpaired two‐tailed t‐test. Graphs show standard deviation and P‐values from three independent experiments.
