
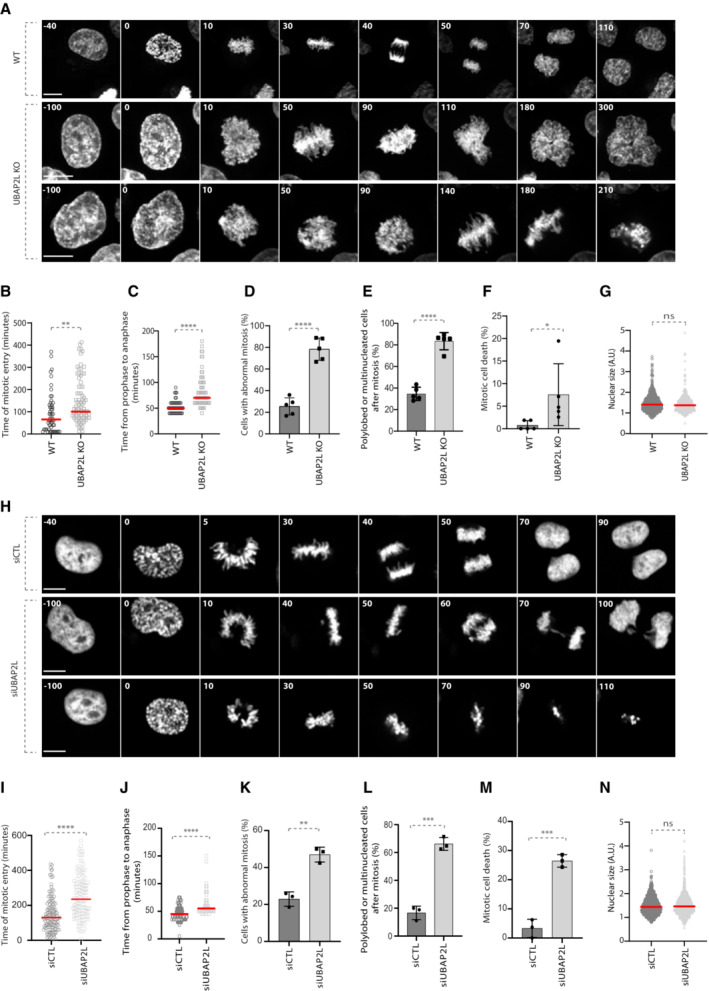
Figure 1. UBAP2L regulates proper chromosome segregation during mitosis.
-
ASpinning disk time‐lapse microscopy of WT and UBAP2L KO HeLa cells synchronized with double thymidine block and release (DTBR) in mitosis. The selected frames of the movies are depicted and the corresponding time is indicated in minutes. SiR–DNA was used for DNA staining. Scale bars, 5 and 8 μm.
-
B, CThe time of mitotic entry (B) and from prophase to anaphase (C) was quantified. At least 50 cells per condition were analyzed for each experiment (n = 5). Red bars represent the mean. Statistics were determined using the Mann–Whitney test (**P < 0.01, ****P < 0.0001).
-
D–FThe percentages of cells with abnormal mitosis (chromosome misalignments and/or DNA bridges) (D), polylobed or multinucleated daughter cells (E) and mitotic cell death (F) were quantified. At least 50 cells per condition were analyzed. Graphs represent the mean of five biological replicates ± standard deviation (SD) (two sample two‐tailed t‐test *P < 0.05, ****P < 0.0001).
-
GThe nuclear size of at least 600 WT and UBAP2L KO interphasic cells was measured. Red bars represent the mean. Statistics were determined by the Mann–Whitney test (ns, non‐significant).
-
HSpinning disk time‐lapse microscopy of HeLa cells transfected with control (siCTL) or UBAP2L siRNA (siUBAP2L) for 48 h and synchronized with DTBR in mitosis. The selected frames of the movies are depicted and the corresponding time is indicated in minutes. SiR–DNA was used for DNA staining. Scale bar, 6 μm.
-
I, JThe time of mitotic entry (I) and from prophase to anaphase (J) was quantified. At least 50 cells per condition were analyzed for each experiment (n = 3). Red bars represent the mean. Statistics were determined using the Mann–Whitney test (****P < 0.0001).
-
K–MThe percentages of cells with abnormal mitosis (chromosome misalignments and/or DNA bridges) (K), polylobed or multinucleated daughter cells (L) and mitotic cell death (M) were quantified. At least 50 cells per condition were analyzed. Graphs represent the mean of three biological replicates ± SD (two sample two‐tailed t‐test **P < 0.01, ***P < 0.001).
-
NThe nuclear size of at least 1,000 control and UBAP2L‐downregulated interphasic cells was measured. Red bars represent the mean. Statistics were determined by the Mann–Whitney test (ns, non‐significant).
Source data are available online for this figure.