
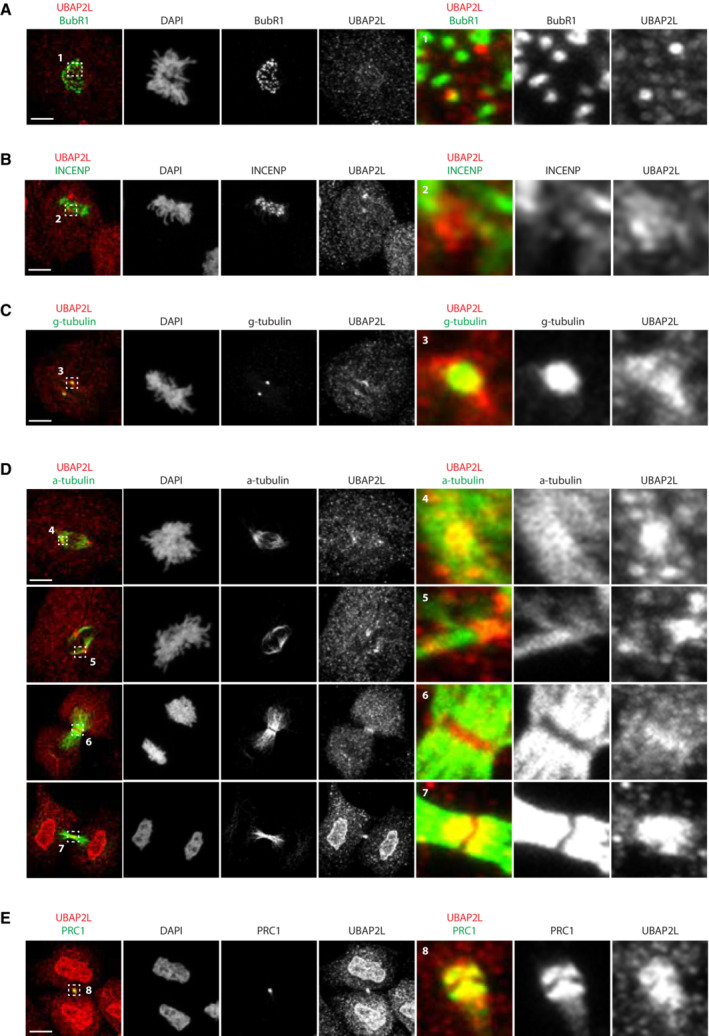
Figure EV2. UBAP2L localization during mitosis.
-
A–ERepresentative IF pictures of HeLa cells synchronized in mitosis using DTBR after chemical pre‐extraction of the cytoplasm using 0.01% of Triton X‐100 for 1m30. UBAP2L localization was assessed by co‐staining with indicated mitotic structures markers. ROIs are shown in the corresponding numbered panels. Scale bar, 5 μm.