
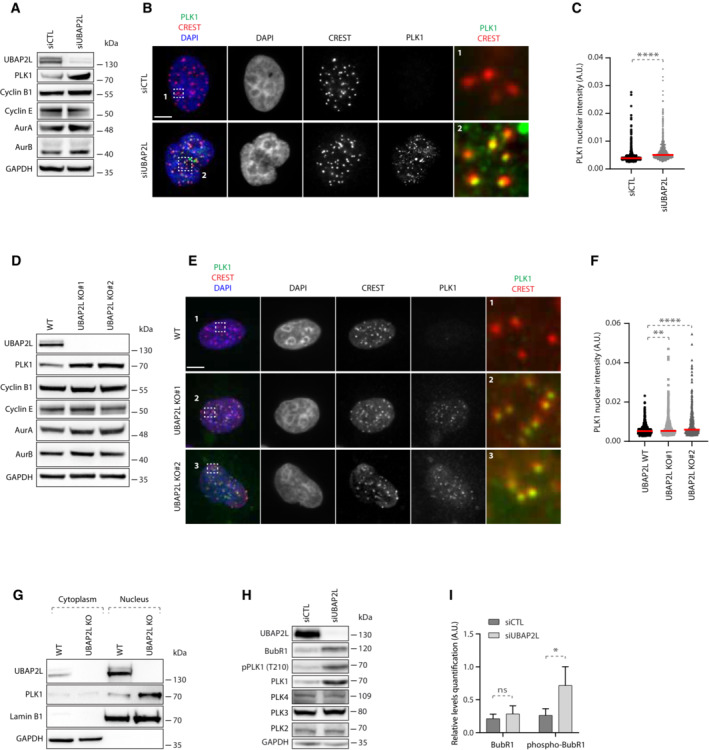
Figure 3. UBAP2L regulates PLK1 levels and activity.
-
AWestern blot (WB) analysis of HeLa cell lysates from G1/S synchronized cells using DTB treated with siCTL or siUBAP2L. Proteins molecular weight (MW) is indicated in kilo Daltons (kDa). WB is representative of three independent replicates.
-
B, CIF representative pictures of G1/S synchronized HeLa cells treated with the indicated siRNAs and quantification of PLK1 nuclear intensity (arbitrary units A.U.) ROIs are shown in the corresponding numbered panels. Scale bar, 5 μm. At least 250 cells were quantified per condition for each replicate. Each dot of graphs (C) represents PLK1 nuclear intensity in a single nucleus where PLK1 signal was detectable. Interphasic cells which do not express PLK1 were excluded from the quantification. The measurements of three biological replicates are combined, red bars represent the mean (Mann–Whitney test ****P < 0.0001).
-
DWB analysis of WT or UBAP2L KO HeLa cell lysates from G1/S synchronized cells using DTB. Proteins MW is indicated in kDa. WB is representative of three independent replicates.
-
E, FIF representative pictures of G1/S synchronized WT or UBAP2L KO HeLa cells using DTB and quantification of PLK1 nuclear intensity (A.U.) ROIs are shown in the corresponding numbered panels. Scale bar, 5 μm. At least 250 cells were quantified per condition for each replicate. Each dot of graphs (F) represents PLK1 nuclear intensity in a single nucleus where PLK1 signal was detectable. Interphasic cells which do not express PLK1 were excluded from the quantification. The measurements of four biological replicates are combined, red bars represent the mean (Kruskal–Wallis test with Dunn's correction **P < 0.01, ****P < 0.0001).
-
GWT or UBAP2L KO G1/S synchronized (DTB) HeLa cells were lysed, fractionated into cytoplasmic and nuclear fractions and analyzed by WB. Proteins MW is indicated in kDa. WB is representative of three independent replicates.
-
HWB analysis of HeLa cell lysates from unsynchronized cells treated with the indicated siRNAs. Proteins MW is indicated in kDa. WB is representative of three independent replicates.
-
IQuantification of the relative protein levels of BubR1. Graphs represent the average ratio of BubR1 (lower band) or phospho‐BubR1 (upper band)/GAPDH (A.U.) from three biological replicates ± SD (two sample two‐tailed t‐test *P < 0.05, ns, non‐significant).
Source data are available online for this figure.