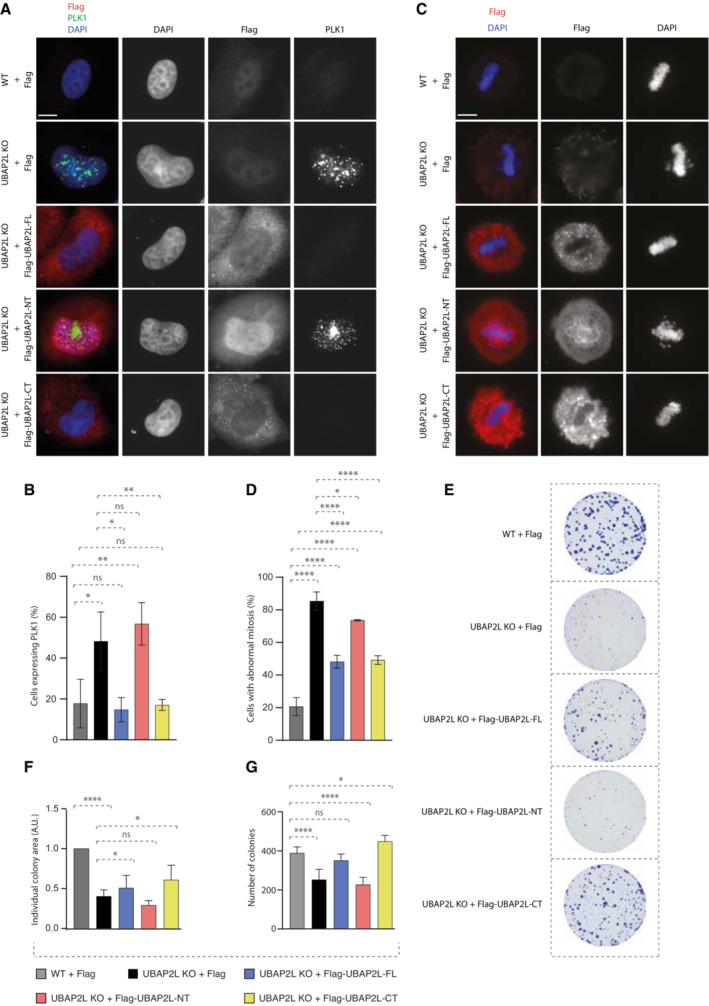
Figure 5. The C‐terminal domain of UBAP2L mediates its function on PLK1 and on mitosis.

-
A, BIF analysis of G1/S synchronized WT or UBAP2L KO HeLa cells using DTB and transfected with the indicated flag‐tagged UBAP2L protein fragments for 48 h (A) and quantification of the percentage of cells expressing PLK1 (B). Scale bar, 5 μm. At least 100 cells per condition were quantified for each experiment. Graphs represent the mean of three replicates ± SD (one‐way ANOVA with Sidak's correction *P < 0.05, **P < 0.01, ns, non‐significant).
-
C, DIF representative pictures of WT or UBAP2L KO HeLa cells transfected with the indicated flag‐tagged UBAP2L protein fragments for 48 h and synchronized in mitosis using monastrol release (MR) (C) and quantification of the percentage of cells with abnormal mitosis (misalignments and/or DNA bridges) (D). Scale bar, 5 μm. At least 50 cells per condition were quantified for each experiment. Graphs represent the mean of three replicates ± SD (one‐way ANOVA with Sidak's correction *P < 0.05, ****P < 0.0001).
-
E–GColony formation assay of WT or UBAP2L KO HeLa cells transiently transfected with the indicated flag‐tagged UBAP2L protein fragments and quantification of the individual colony area (F) and of the number of colonies (G) after 7 days of culture. Graphs represent the mean of three replicates ± SD (one‐way ANOVA with Sidak's correction *P < 0.05, ****P < 0.0001, ns, non‐significant).
Source data are available online for this figure.
