
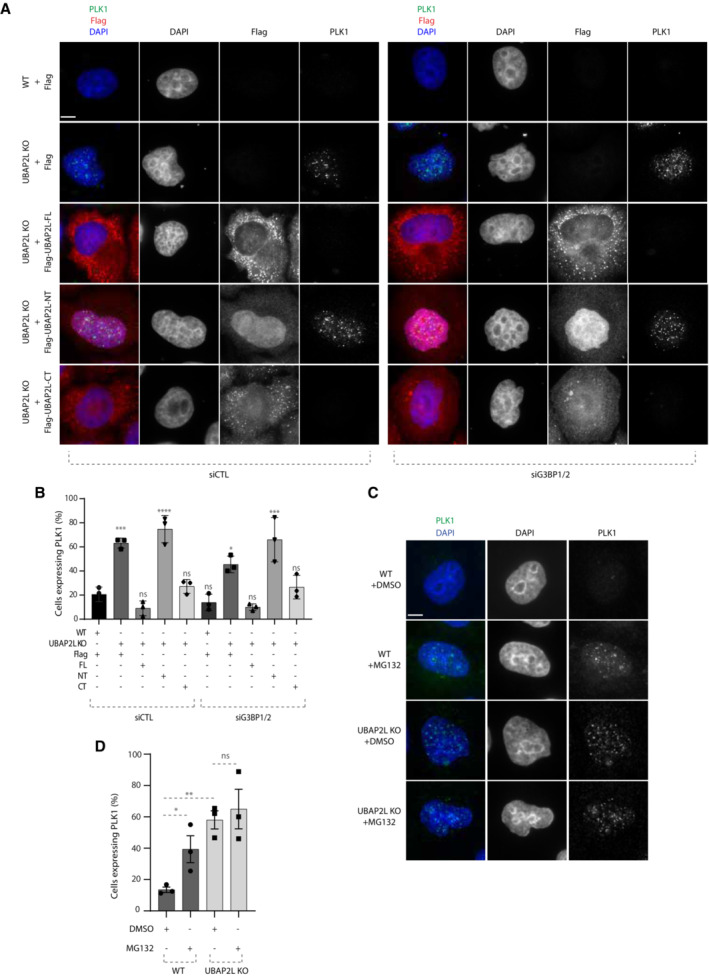
Figure 6. UBAP2L‐mediated regulation of PLK1 is independent of stress signaling.
-
A, BRepresentative IF images of WT or UBAP2L KO HeLa cells synchronized in G1/S using DTB and transfected with the indicated flag‐tagged UBAP2L constructs and control or G3BP1/2 siRNAs for 48 h (A) and quantification of the percentage of cells expressing PLK1 (B). Scale bar, 4 μm. At least 150 cells were quantified per condition for each experiment. The graph depicted in (B) represents the mean of three replicates ± SD (one‐way ANOVA with Sidak's correction *P < 0.05, ***P < 0.001, ****P < 0.0001, ns, non‐significant).
-
C, DRepresentative IF images of WT or UBAP2L KO HeLa cells synchronized in G1/S using DTB and treated with vehicle (DMSO) or 25 μM of MG132 for 4 h (C) and quantification of the percentage of cells expressing PLK1 (D). Scale bar, 4 μm. At least 150 cells were quantified per condition for each experiment. The graph depicted in (D) represents the mean of three replicates ± SD (one‐way ANOVA with Sidak's correction *P < 0.05, **P < 0.01, ns, non‐significant).
Source data are available online for this figure.