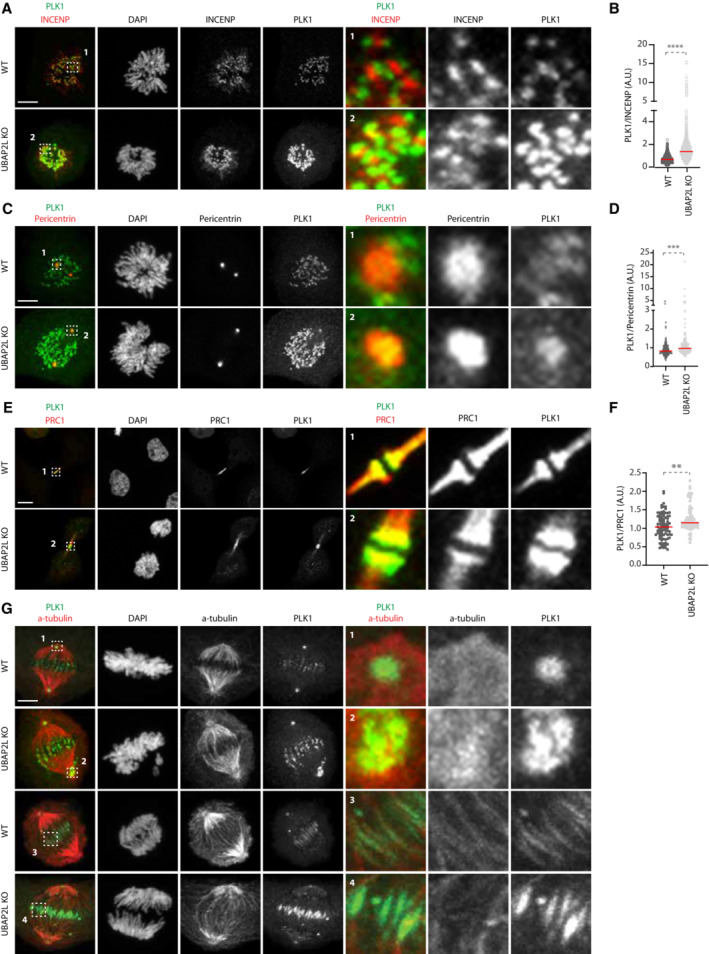
Figure 8. UBAP2L controls PLK1 localization at several mitotic structures.

-
A, BRepresentative IF pictures of WT or UBAP2L KO HeLa cells synchronized in mitosis with DTBR (A) and quantification of the relative PLK1 intensity at the inner centromere (A.U.) (B). ROIs are shown in the corresponding numbered panels. Scale bar, 5 μm. At least 50 cells were quantified per condition for each experiment. Each dot represents PLK1/INCENP intensity ratio at a single centromere. The measurements of three biological replicates are combined, red bars represent the mean (Mann–Whitney test ****P < 0.0001).
-
C, DRepresentative IF pictures of WT or UBAP2L KO HeLa cells synchronized in mitosis with DTBR (C) and quantification of the relative PLK1 intensity at the centrosomes (A.U.) (D). ROIs are shown in the corresponding numbered panels. Scale bar, 5 μm. At least 50 cells were quantified per condition for each experiment. Each dot represents PLK1/Pericentrin intensity ratio at a single centrosome. The measurements of three biological replicates are combined, red bars represent the mean (Mann–Whitney test ****P < 0.0001).
-
E, FRepresentative IF pictures of WT or UBAP2L KO HeLa cells synchronized in mitosis with DTBR (E) and quantification of the relative PLK1 intensity at the midbody (A.U.) (F). ROIs are shown in the corresponding numbered panels. Scale bar, 4 μm. At least 50 cells were quantified per condition for each experiment. Each dot represents PLK1/PRC1 intensity ratio at the midbody. The measurements of three biological replicates are combined, red bars represent the mean (Mann–Whitney test **P < 0.01).
-
GRepresentative IF pictures of WT or UBAP2L KO HeLa cells synchronized in mitosis with DTBR (n = 3) to qualitatively assess the localization of PLK1 at the mitotic spindle with α‐tubulin staining. ROIs are shown in the corresponding numbered panels. Scale bar, 5 μm.
Source data are available online for this figure.
