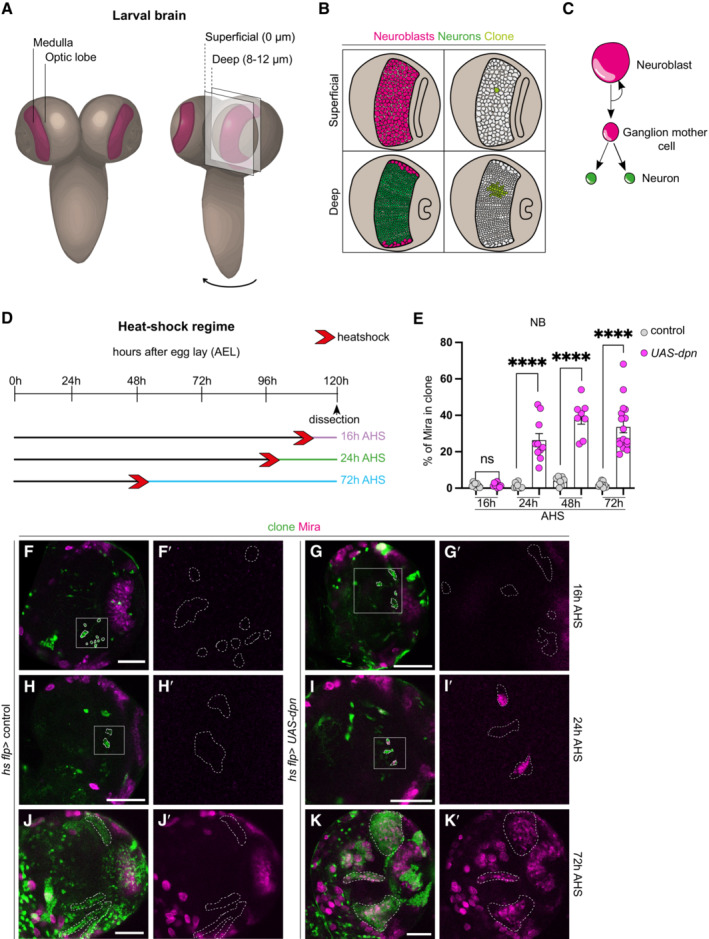
Figure 1. Dpn overexpression causes reversion of neurons to NBs in the deep layers of the developing CNS.

-
ASchematic representation of the larval central nervous system (CNS). Medulla (depicted in maroon) is located with the optic lobes (OLs) of the CNS. Cross section and cell composition at superficial surface (0 μm) and deep layer (8–12 μm) of the OLs are depicted in (B).
-
B(left) Superficial surface is occupied by neuroblasts (NBs, pink), and deep layers are occupied by neurons (green). (right) Cross section through a hs flp clone (light green) showing the clone consists of a single NB in the superficial layer and its neuronal progeny in the deep layer.
-
CSchematic representation of NB divisions: NBs undergo asymmetric division to give rise to a Ganglion mother cell (GMC) that produces two neurons.
-
DSchematic depicting the heat shock regimes used in (E–K). Clones were induced via heat shock (red arrows), and dissected at 16 h (purple), 24 h (green), and 72 h (blue) after heat shock.
-
EQuantification of % Mira+ cells in control and UAS‐dpn clones (calculated as the ratio of Mira+ cell volume as a percentage of total clone volume). Sixteen hours (Control n = 9, m = 1.584 ± 0.3779, UAS‐dpn n = 9, m = 1.657 ± 0.37), 24 h (Control n = 9, m = 1.150 ± 0.4781, UAS‐dpn n = 10, m = 26.37 ± 3.629), 48 h (Control n = 7, m = 3.971 ± 0.9249, UAS‐dpn n = 8, m = 38.56 ± 3.446), 72 h (Control n = 9, m = 1.874 ± 0.4897, UAS‐dpn n = 17, m = 33.62 ± 3.243).
-
F–K′(F′, G′, H′, I′) are the magnified images of the square region outlined in (F, G, H, I). (F–K) are merged images, (F′–K′) are single channel images of (F–K) depicting the presence of NBs (Mira+). Clones (green) are outlined by dotted lines. All images in this figure, and all following figures are single confocal sections. (F–F′ and G–G′) No Mira+ NBs are recovered in deep sections of control or UAS‐dpn clones at 16 h after clone induction. Quantified in (E). (H–H′ and I–I′) At 24 h after clone induction, Mira+ NBs are recovered in UAS‐dpn but not control clones. Quantified in (E). (J–J′ and K–K′) At 72 h after clone induction, numerous Mira+ NBs are recovered in UAS‐dpn but not in control clones. Quantified in (E).
Data information: Data are represented as mean ± SEM. P‐values were obtained using unpaired t‐test, and Welch's correction was applied in case of unequal variances. ****P < 0.0001. Scale bars: 50 μm.
