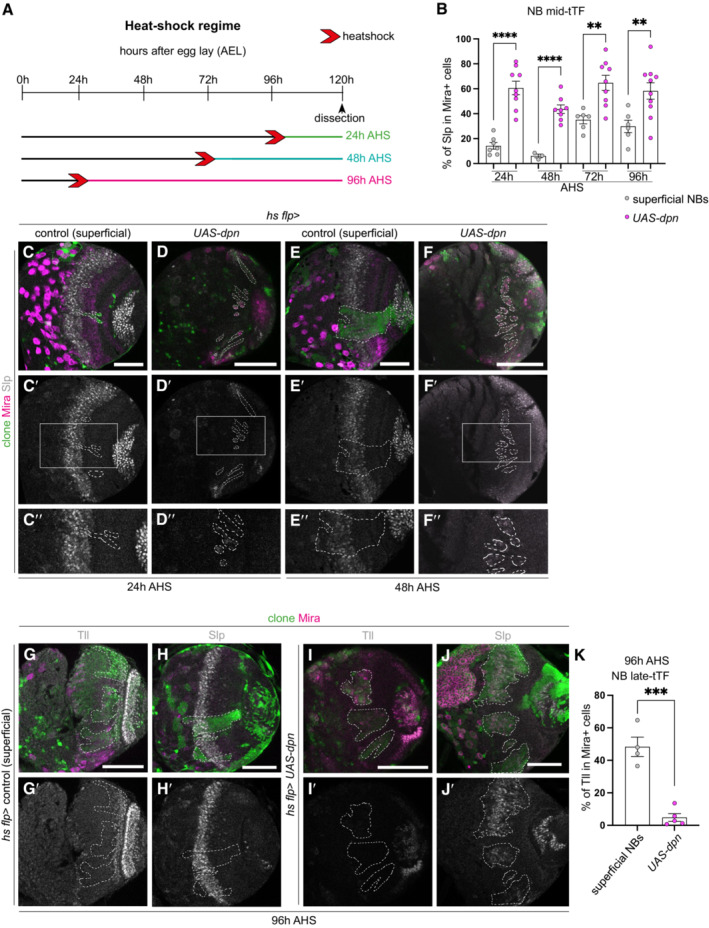
Figure 3. Ectopic NBs generated via dpn overexpression immediately adopt a mid‐temporal identity.

-
ASchematic depicting the heat shock regimes used in (B–F″) and (G–K′). Clones were induced via heat shock (red arrows) and dissected at 24 h (green), 48 h (turquoise), or 96 h (pink) after heat shock.
-
BQuantification of % of Slp+ cells in Mira+ cells in control and UAS‐dpn clones (expressed as the ratio between Slp+ volume and total Mira+ volume within a clone). 24 h (Control n = 7, m = 14.25 ± 2.696, UAS‐dpn n = 9, m = 60.66 ± 5.384), 48 h (Control n = 3, m = 6.096 ± 1.509, UAS‐dpn n = 8, m = 43.64 ± 3.398), 72 h (Control n = 6, m = 35.13 ± 3.242, UAS‐dpn n = 9, m = 64.72 ± 6.045), 96 h (Control n = 6, m = 29.85 ± 4.951, UAS‐dpn n = 10, m = 58.2 ± 6.603).
-
C–F″Representative images of the deep medulla neuronal layer in the larval optic lobe, in which UAS‐dpn or control are driven by hs flp (marked by GFP and outlined) and dissected and stained with the stem cell marker, Miranda (Mira, magenta), and Sloppy‐paired (Slp, grey). At 24 and 48 h after clone induction, Mira+ NBs express mid tTF Slp compared to superficial NB control, quantified in (B). (C″, D″, E″, F″) are the magnified images of the square region outlined in (C′, D′, E′, F′), respectively.
-
G–J′At 96 h after clone induction, Mira+ NBs express mid tTF Slp and do not express late tTF Tll, compared to control, quantified in (B and K).
-
KQuantification of % of Tll+ cells in Mira+ cells in control and UAS‐dpn clones (expressed as the ratio between Tll+ volume and total Mira+ volume within a clone). Control n = 4, m = 48.34 ± 5.956, UAS‐dpn n = 5, m = 4.805 ± 2.375.
Data information: Data are represented as mean ± SEM. P‐values were obtained performing unpaired t‐test, and Welch's correction was applied in case of unequal variances. ****P < 0.0001, ***P < 0.001, **P < 0.005, *P < 0.05. Scale bars: 50 μm.
