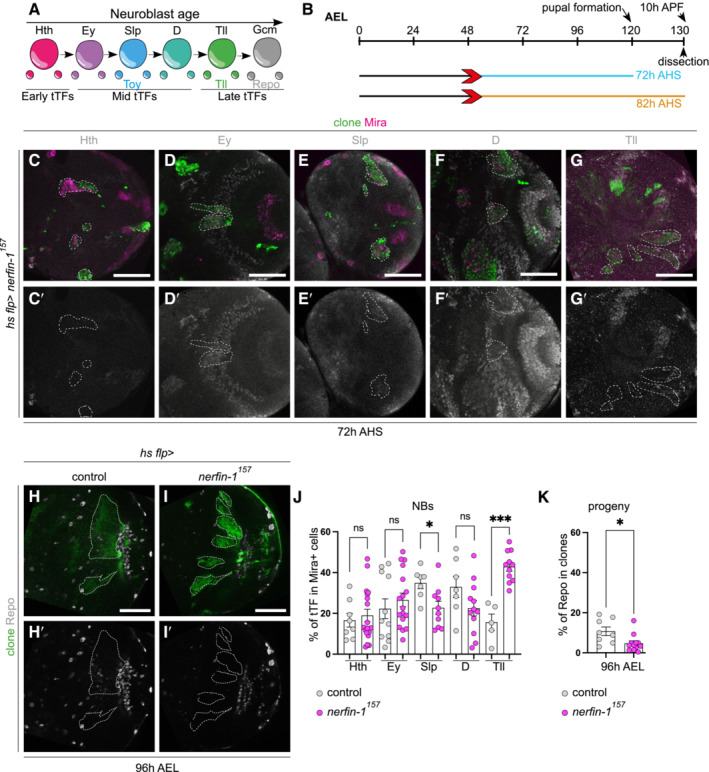
Figure EV5. Ectopic NBs generated via nerfin‐1 express excess Tll at the expense of Repo.

-
ASchematic representation of temporal series in neuroblasts (NBs). NBs express temporal transcription factors (tTFs) (Hth, Ey, Slp, D, Tll) as they age. These can be categorised into early, mid, and late tTFs.
-
BSchematic depicting the heat shock regimes used in (C–G′, H–K′). Clones were induced via heat shock (red arrows) and dissected at 72 h (96 h AEL, blue) or 82 h (10 h APF, orange) after heat shock.
-
C–I′(C–G′, H–I′) Representative images of the deep medulla neuronal layer in the larval and pupal optic lobe, in which nerfin‐1 157 is driven in clones by hs flp (marked by GFP and outlined) and stained with the stem cell marker, Miranda (Mira, magenta), and various temporal transcription factors (tTFs) (grey). (C–G′) At 72 h AHS, in deep sections of the clone induced via nerfin‐1 157 , Mira+ NBs express all temporal series transcription factors. Quantified in (J). (H–I′) At 72 and 82 h AHS, there is less Repo+ (grey) progeny in nerfin‐1 157 mutant clones compared with the control. Quantified in (K).
-
JQuantification of volume of cells that express a specific tTF as % of total Mira+ NB volume within a clone. Hth (Control, n = 8, m = 16.63 ± 3.335, nerfin‐1 157 , n = 18, m = 18.96 ± 3.083), Ey (Control, n = 11, m = 22.28 ± 4.833, nerfin‐1 157 , n = 17, m = 26.59 ± 3.32), Slp (Control, n = 7, m = 34.87 ± 2.753, nerfin‐1 157 , n = 10, m = 22.71 ± 3.18), D (Control, n = 7, m = 32.97 ± 5.22, nerfin‐1 157 , n = 12, m = 22.55 ± 3.768), Tll (Control, n = 5, m = 15.65 ± 4.036, nerfin‐1 157 , n = 11, m = 42.87, ±2.25).
-
KQuantification of % Repo+ cells within control and nerfin‐1 157 mutant clones (calculated as the ratio of Repo+ cell volume as a percentage of total clone volume). 72 h AHS (Control n = 8, m = 10.73 ± 2.148, nerfin‐1 157 , n = 12, m = 4.741 ± 1.224), 82 h AHS (Control n = 6, m = 28.64 ± 6.967, nerfin‐1 157 , n = 6, m = 8.246 ± 1.301).
Data information: Data are represented as mean ± SEM. P‐values were obtained performing unpaired t‐test, and Welch's correction was applied in case of unequal variances. *P < 0.05 and ***P < 0.001. Scale bars: 50 μm.
