
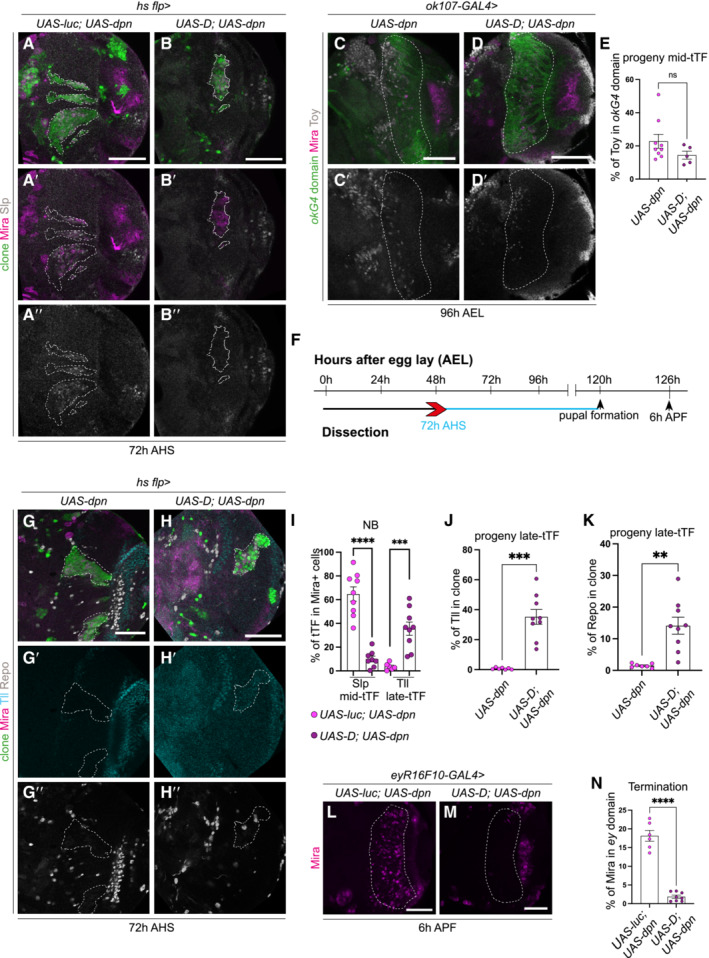
Figure 6. Dichaete triggers the re‐initiation of the temporal series.
-
A–H″(A–B″ and G–H″) Representative images of deep medulla neuronal layer in the larval optic lobe, in which UAS‐luc; UAS‐dpn and UAS‐D; UAS‐dpn are expressed in clones by hs flp, and stained with the stem cell marker, Miranda (Mira, magenta), and/or Slp, Tll or Repo (grey). (A–B″) At 72 h after clone induction, Mira+neuroblasts (NBs) within UAS‐luc; UAS‐dpn clones express Slp; Mira+ NBs within UAS‐D; UAS‐dpn clones do not express Slp, quantified in (I). (C–D′) Representative images of deep medulla neuronal layer in the larval optic lobe, in which UAS‐dpn and UAS‐D; UAS‐dpn are expressed in the ok107‐GAL4 expression domain, and stained with the stem cell marker, Mira (magenta), and mid‐temporal progeny marker, Toy‐GFP (grey). Fewer Toy+ cells were recovered within the ok107‐GAL4 domain (outlined) in UAS‐D; UAS‐dpn compared to UAS‐dpn, quantified in (E). (E) Quantification of % Toy+ cells within ok107‐GAL4 expression domain in UAS‐dpn and UAS‐D; UAS‐dpn (calculated as the ratio of Toy+ cell volume as a percentage of total ok107‐GAL4 domain volume). UAS‐dpn n = 9, m = 22.78 ± 4.174, UAS‐D; UAS‐dpn n = 5, m = 14.42 ± 2.394. (F) Timeline depicting the age of ectopic neuroblasts. Pupal formation occurs at 120 h AEL. Pupae are dissected at 126‐h AEL (6‐h APF). Heat shock regime for (A–B″) and (G–H″). Clones were induced by heat shock (red) at 48 h AEL and dissected at 72‐h (blue) after heat shock. (G–H″) At 72 h after clone induction, more Tll+ and Repo+ cells were recovered within UAS‐D; UAS‐dpn clones compared to UAS‐dpn clones, quantified in (I–K).
-
IQuantification of % of Slp+ or Tll+ cells in Mira+ cells UAS‐luc; UAS‐dpn clones compared to UAS‐D; UAS‐dpn clones (expressed as the ratio between tTF+ volume and total Mira+ volume within a clone). Slp (UAS‐luc; UAS‐dpn n = 9, m = 64.72 ± 6.045, UAS‐D; UAS‐dpn n = 8, m = 9.99 ± 2.463), Tll (UAS‐luc; UAS‐dpn n = 6, m = 3.584 ± 1.187, UAS‐D; UAS‐dpn n = 9, m = 35.53 ± 5.596).
-
J, KQuantification of % Tll+ or Repo+ cells within UAS‐dpn clones compared with UAS‐D; UAS‐dpn clones (calculated as the ratio of Tll+ or Repo+ cell volume as a percentage of total clone volume). Tll (UAS‐dpn n = 7, m = 0.7198 ± 0.2389, UAS‐D; UAS‐dpn n = 9, m = 35.22 ± 4.917), Repo (UAS‐dpn n = 7, m = 1.488 ± 0.2368, UAS‐D; UAS‐dpn n = 9, m = 14.13 ± 2.672).
-
L, MMira+ NBs are present in deep sections of UAS‐dpn driven by eyR16F10‐GAL4 at 126 h but are absent in UAS‐D; UAS‐dpn, quantified in (N).
-
NQuantification of % Mira cells within eyR16F10‐GAL4 expression domain in UAS‐dpn and UAS‐D; UAS‐dpn (calculated as the ratio of Mira+ cell volume as a percentage of total eyR16F10‐GAL4 domain volume). UAS‐dpn n = 6, m = 18.13 ± 1.46, UAS‐D; UAS‐dpn n = 8, m = 1.859 ± 0.4215.
Data information: Data are represented as mean ± SEM. P‐values were obtained via unpaired t‐test, and Welch's correction was applied in cases of unequal variances. ****P < 0.0001, ***P < 0.001, **P < 0.005. Scale bars: 50 μm.