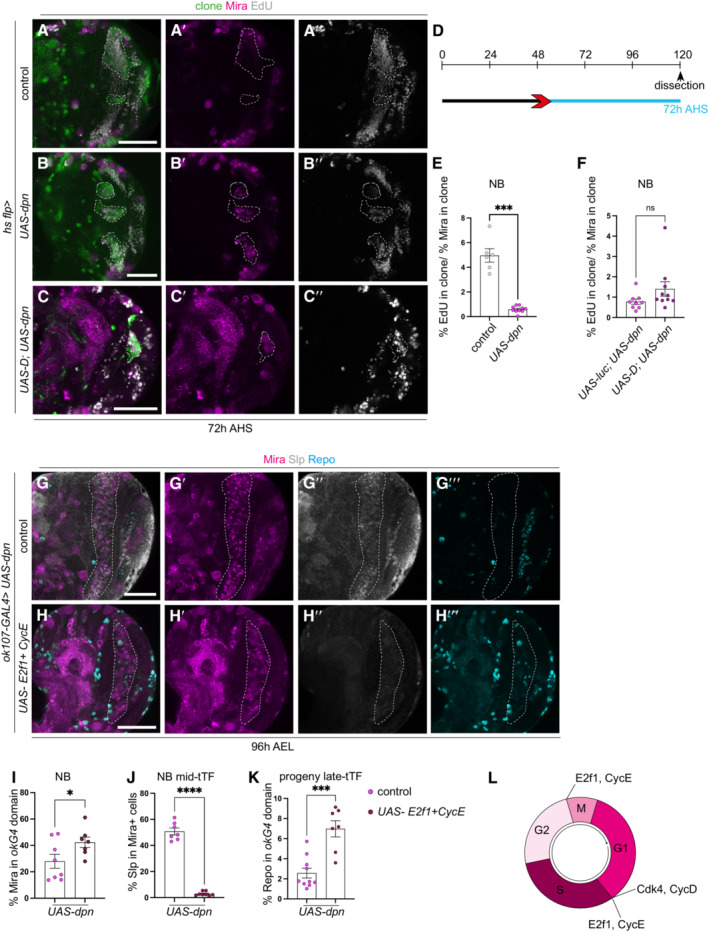
Figure 7. Temporal progression of dedifferentiated NBs is regulated by the cell cycle.

-
A–C″Representative images of the deep medulla neuronal layer in the larval optic lobe, in which control (UAS‐luc) and UAS‐dpn and UAS‐D; UAS‐dpn are expressed in hs flp clones (72 h after clone induction). Miranda (Mira, magenta) and EdU (grey). Despite increased number of Mira+ cells in UAS‐dpn compared to control, each neuroblast (NB) underwent slower cell cycle progression, as indicated by EdU+ incorporation. Quantified in (E). This slow cell cycle speed was not rescued in UAS‐D; UAS‐dpn clones. Quantified with UAS‐luc; UAS‐dpn in (F).
-
DHeat shock regime for (A–C″). Clones were induced by heat shock (red) at 48‐h AEL and dissected 72‐h (blue) after heat shock.
-
EQuantification of % of EdU‐positive cells in control (UAS‐luc) and UAS‐dpn clones (expressed as the amount of EdU+ cells per Mira+ volume within the clone). Control n = 6, m = 4.96 ± 0.5433, UAS‐dpn n = 10, m = 0.5927 ± 0.08484.
-
FQuantification of % of EdU‐positive cells in UAS‐luc; UAS‐dpn and UAS‐D; UAS‐dpn clones (expressed as the amount of EdU+ cells per Mira+ volume within the clone). UAS‐luc; UAS‐dpn n = 9, m = 0.7807 ± 0.1311, UAS‐D; UAS‐dpn n = 10, m = 0.4866 ± 0.3579.
-
G–H‴Representative images of the deep medulla neuronal layer in the larval optic lobe, where UAS‐ E2f1; UAS‐ CycE; UAS‐dpn or UAS‐dpn are expressed in the ok107‐GAL4 domain (outlined), and stained with the stem cell marker, Mira (magenta), mid‐tTF, Slp (grey) and late progeny marker, Repo (Cyan). Quantified in (I–K). UAS‐dpn NBs express Slp and do not create Repo+ progeny, whereas UAS‐ E2f1; UAS‐ CycE; UAS‐dpn NBs do not express Slp and create Repo+ progeny.
-
IQuantification of % Mira+ cells within ok107‐GAL4 expression domain in UAS‐dpn control and UAS‐ E2f1; UAS‐ CycE; UAS‐dpn (calculated as the ratio of Mira+ cell volume as a percentage of total ok107‐GAL4 volume). UAS‐dpn control n = 8, m = 27.99 ± 5.288, UAS‐ E2f1; UAS‐ CycE; UAS‐dpn n = 7, m = 42.37 ± 3.999.
-
JQuantification of % Slp+ cells in Mira‐positive cells within the ok107‐GAL4 expression domain in UAS‐dpn; UAS luc and UAS‐E2f1; UAS‐CycE; UAS‐dpn (calculated as the ratio of Slp+ cellular volume as a percentage of total Mira+ volume within ok107‐GAL4 domain). UAS‐dpn control n = 7, m = 50.76 ± 2.582, UAS‐E2f1; UAS‐CycE; UAS‐dpn n = 8, m = 2.907 ± 0.5755.
-
KQuantification of % Repo+ progeny in within the ok107‐GAL4 expression domain in UAS‐dpn; UAS luc and UAS‐E2f1; UAS‐CycE; UAS‐dpn (calculated as the ratio of Repo+ cellular volume within ok107‐GAL4 domain). UAS‐dpn control n = 10, m = 2.567 ± 0.491, UAS‐E2f1; UAS‐CycE; UAS‐dpn n = 7, m = 6.977 ± 0.8049.
-
LSchematic representation of the cell cycle. Cdk4/CycD and E2f/CycE play roles in G1/S phase transition. E2f/ CycE play a role in G1/S and G2/M phase transitions.
Data information: Data are represented as mean ± SEM. P‐values were obtained performing unpaired t‐test, and Welch's correction was applied in case of unequal variances. ****P < 0.0001, ***P < 0.001, **P < 0.005, *P < 0.05. Scale bars: 50 μm.
