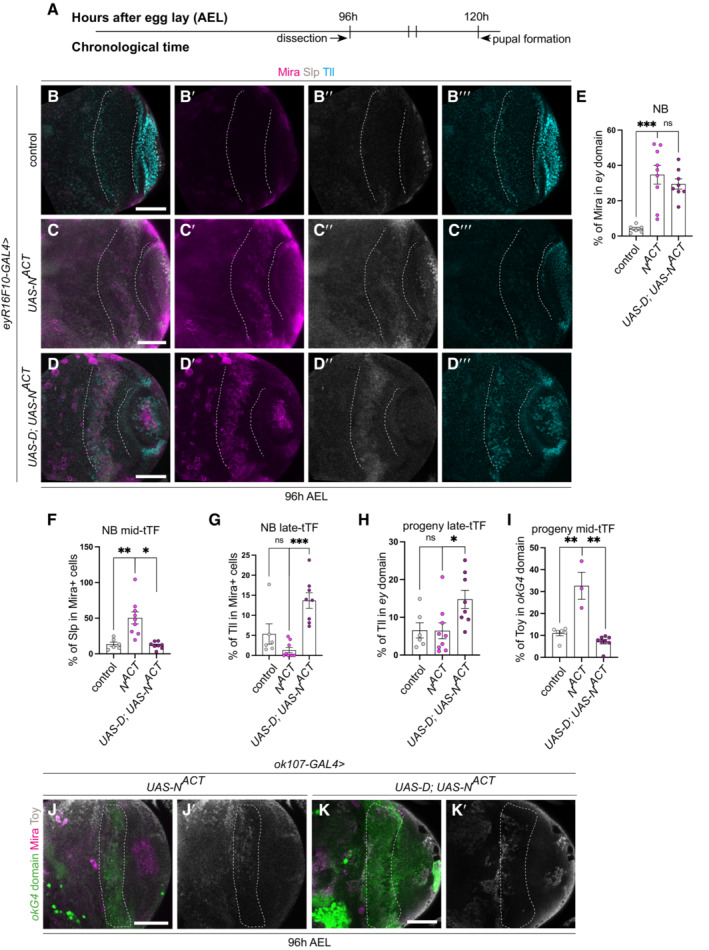
Figure 8. Dichaete re‐initiates the temporal series in dedifferentiated NBs caused by Notch activation.

-
ATimeline depicting age of ectopic neuroblasts (NBs). Larvae are dissected at 96 h AEL.
-
B–D‴Representative images of the deep medulla neuronal layer in the larval optic lobe, in which control (UAS‐luc), UAS‐N ACT , and UAS‐D; UAS‐N ACT are driven by eyR16F10‐GAL4 (outlined). Miranda (Mira, magenta), Sloppy paired (Slp, grey), Tailless (Tll, cyan). UAS‐N ACT NBs express Slp and not Tll. UAS‐D; UAS‐N ACT NBs express Slp and Tll, quantified in (E–H).
-
EQuantification of % Mira‐positive cells within eyR16F10‐GAL4 expression domain in control, UAS‐N ACT , and UAS‐D; UAS‐N ACT (calculated as the ratio of Mira+ cell volume as a percentage of total volume of eyR16F10‐GAL4 domain). Control n = 6, m = 4.077, ±2.103, UAS‐N ACT n = 9, m = 34.71, ±5.271, UAS‐D; UAS‐N ACT n = 8, m = 29.5, ±2.931.
-
F, GQuantification of % Slp+ or Tll+ cells in Mira‐positive cells within the eyR16F10‐GAL4 expression domain in control, UAS‐N ACT , and UAS‐D; UAS‐N ACT (calculated as % of Slp+ or Tll+ cellular volume that are also Mira+ within eyR16F10‐GAL4 domain). Slp (Control n = 6, m = 13.62 ± 2.974, UAS‐N ACT n = 9, m = 13.62 ± 2.974, UAS‐D; UAS‐N ACT n = 8, m = 11.98 ± 1.741), Tll (Control n = 6, m = 5.363 ± 2.531, UAS‐N ACT n = 9, m = 1.316 ± 0.643, UAS‐D; UAS‐N ACT n = 8, m = 13.71 ± 1.955).
-
HQuantification of % Tll+ cells within eyR16F10‐GAL4 expression domain in control,UAS‐N ACT , and UAS‐D; UAS‐N ACT (calculated as the ratio of Tll+ cellular volume as a percentage of total volume of eyR16F10‐GAL4 domain). Control n = 6, m = 6.554 ± 2.018, UAS‐N ACT n = 9, m = 6.449 ± 2.099, UAS‐D; UAS‐N ACT n = 8, m = 14.77 ± 2.404.
-
IQuantification of % Toy+ cells within ok107‐GAL4 expression domain in control (UAS‐luc), UAS‐N ACT and UAS‐ N ACT ; UAS‐dpn (calculated as the ratio of Toy+ cell volume as a percentage of total ok107‐GAL4 domain volume). The column for Control uses the same data points as in Fig 3K. Control n = 6, m = 11.03 ± 1.169, UAS‐N ACT n = 3, m = 32.65 ± 6.176, UAS‐N ACT ; UAS‐dpn n = 8, m = 7.178 ± 1.023).
-
J–K′Representative images of the deep medulla neuronal layer in the larval optic lobe, in which UAS‐N ACT and UAS‐N ACT ; UAS‐dpn are driven by ok107‐GAL4 (marked by GFP and outlined) and stained with the stem cell marker, Mira (magenta), and mid‐temporal progeny marker, Toy‐GFP (grey). Fewer cells express Toy+ in UAS‐N ACT ; UAS‐dpn compared to UAS‐N ACT , quantified in (I).
Data information: Data are represented as mean ± SEM. P‐values were obtained performing unpaired t‐test, and Welch's correction was applied in case of unequal variances. ****P < 0.0001, ***P < 0.001, **P < 0.005. Scale bars: 50 μm.
